Here’s a look at most of the major broad US equity indices from both a daily & weekly (long-term) perspective. As noted on several of the weekly charts below, we need to see at least one solid weekly close below these bull market uptrend lines preferably all major US indices in order to help reduce the odds of a whipsaw sell signal.
Essentially we have bearish price action, via numerous daily & weekly trendline breaks on nearly all major US indices, in addition sell signals from the recently highlighted trend indicators such as the 50/20-day ema pair bearish crossovers on all major US indices (except the $RUT & $SML small-cap indices, which are poised to trigger death crosses on any additional downside).
Click on the first chart below to expand, then click anywhere on the right of the expanded chart to advance to the next chart. Expanded charts can be panned & zoomed using a touchpad or mouse scroll wheel.
-

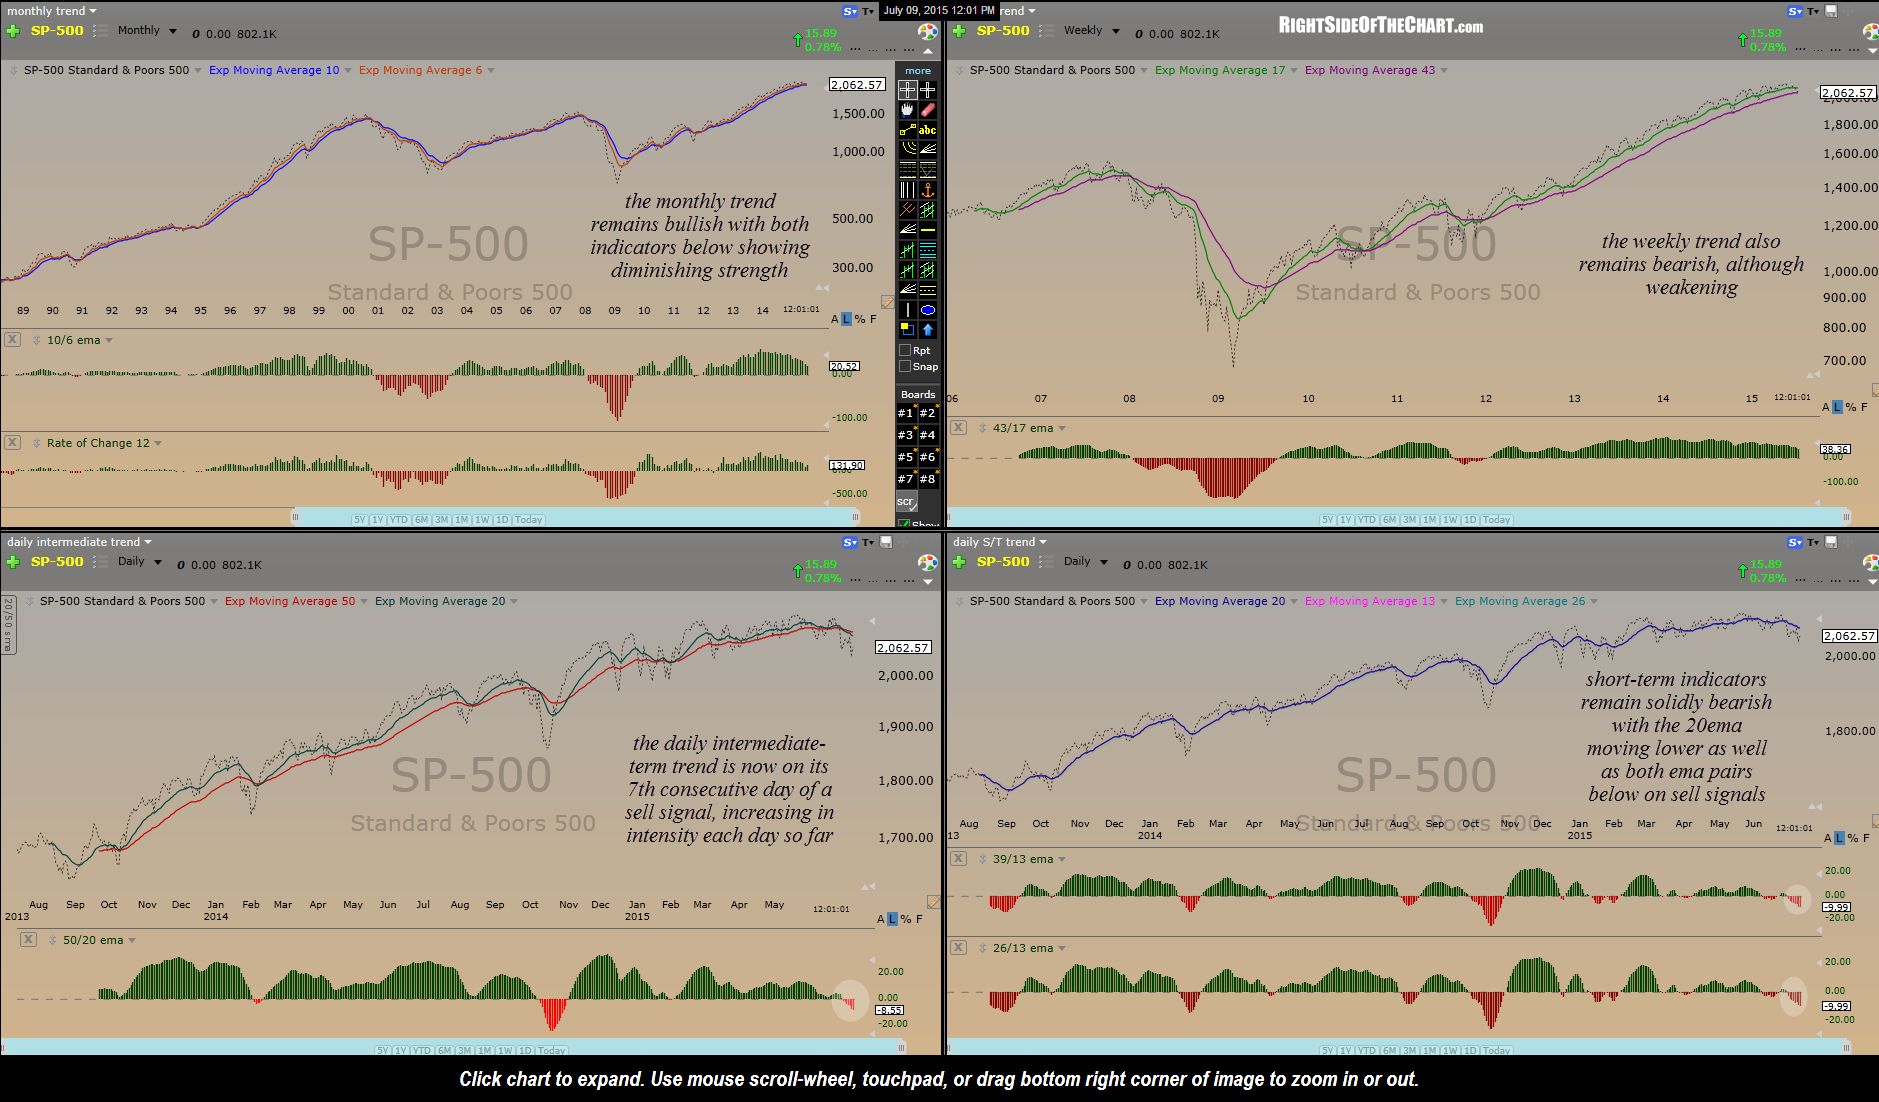
- $SPX trend indicators July 9th
-
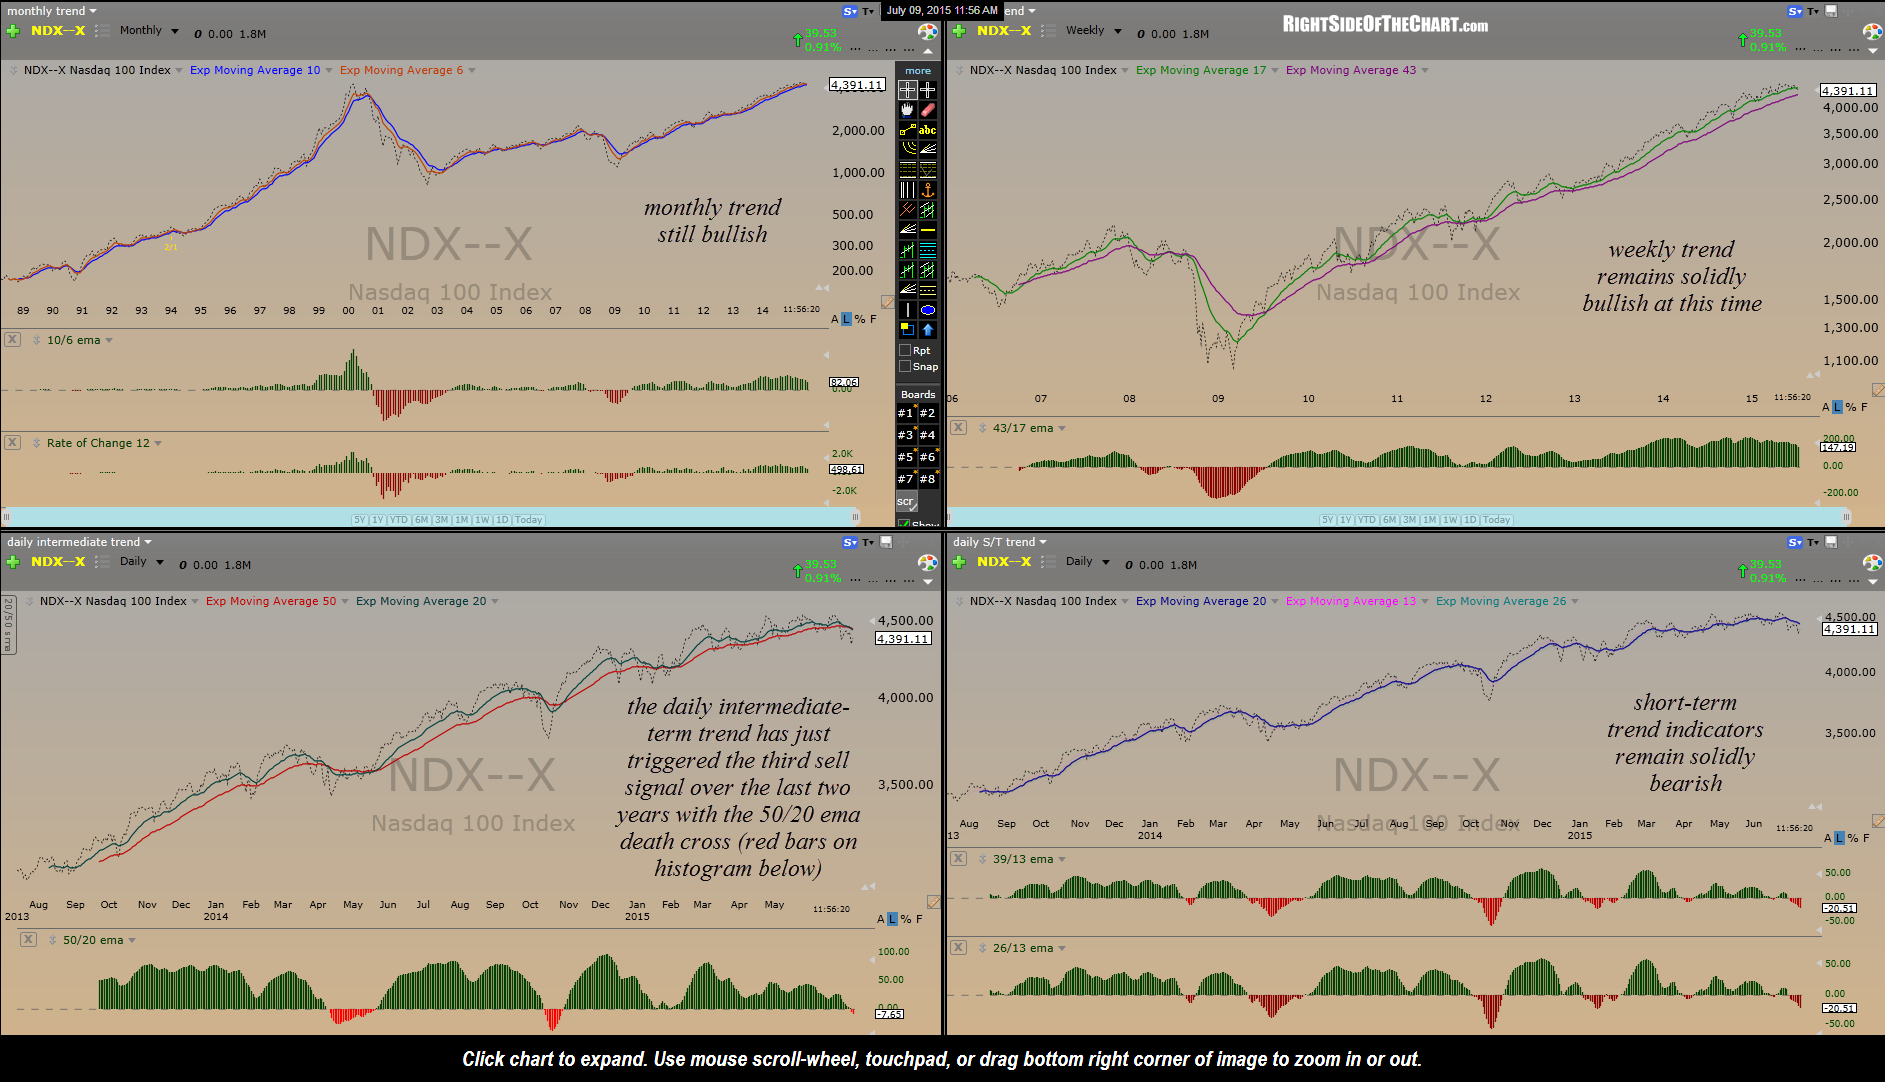
- $NDX trend indicators July 9th
-
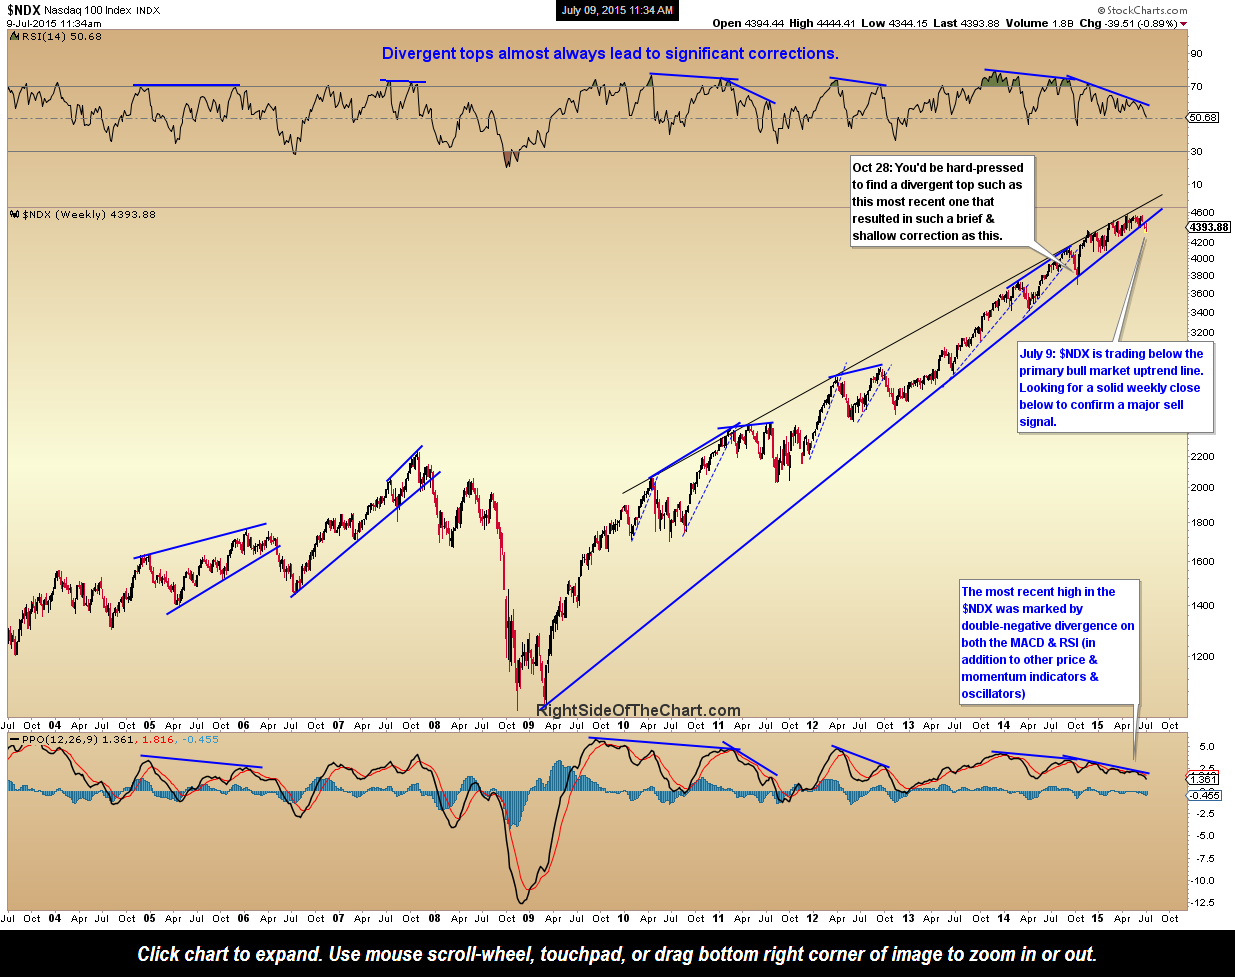
- $NDX weekly July 9th
-
- $COMPQ daily July 9th

-
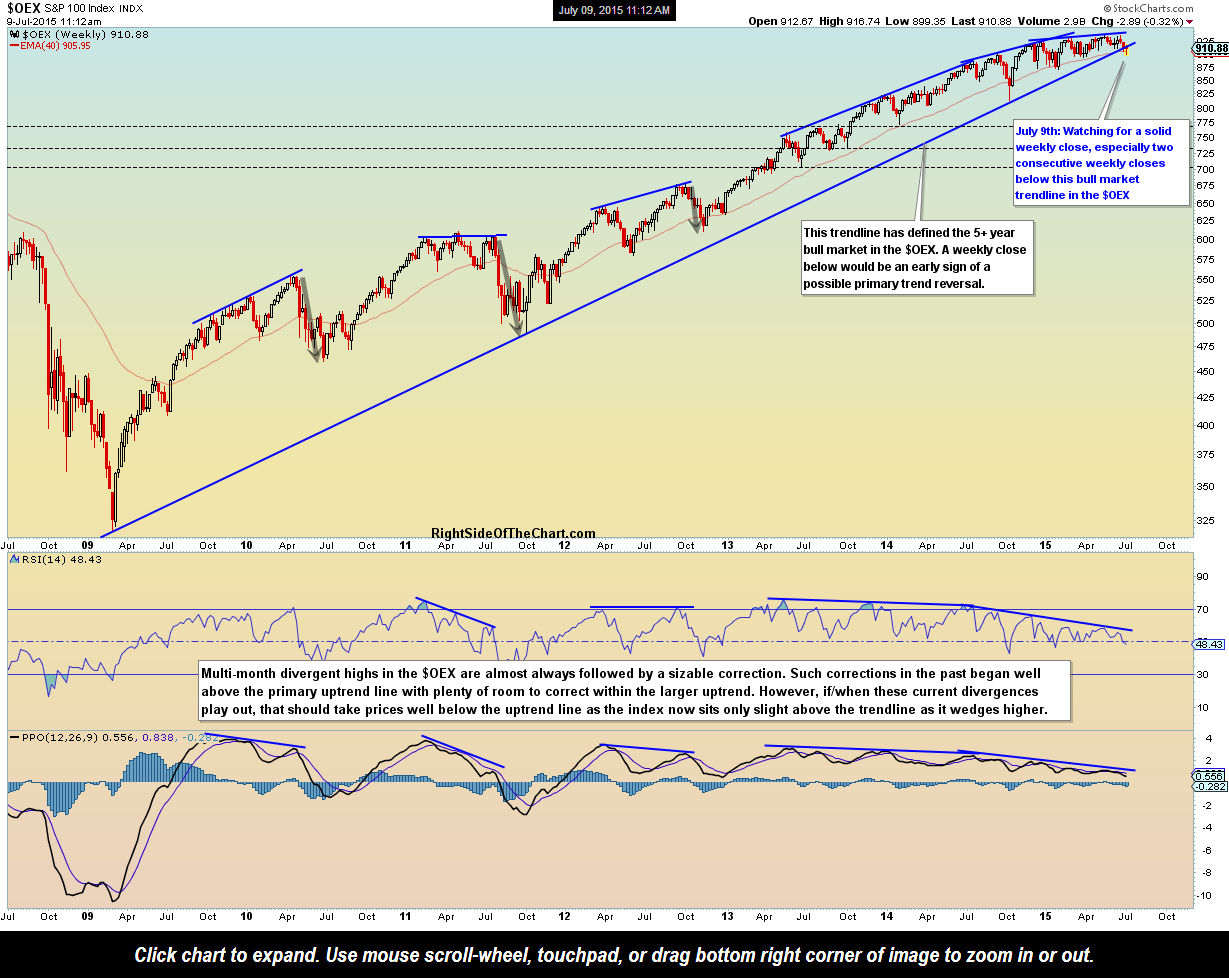
- $OEX weekly July 9th
-
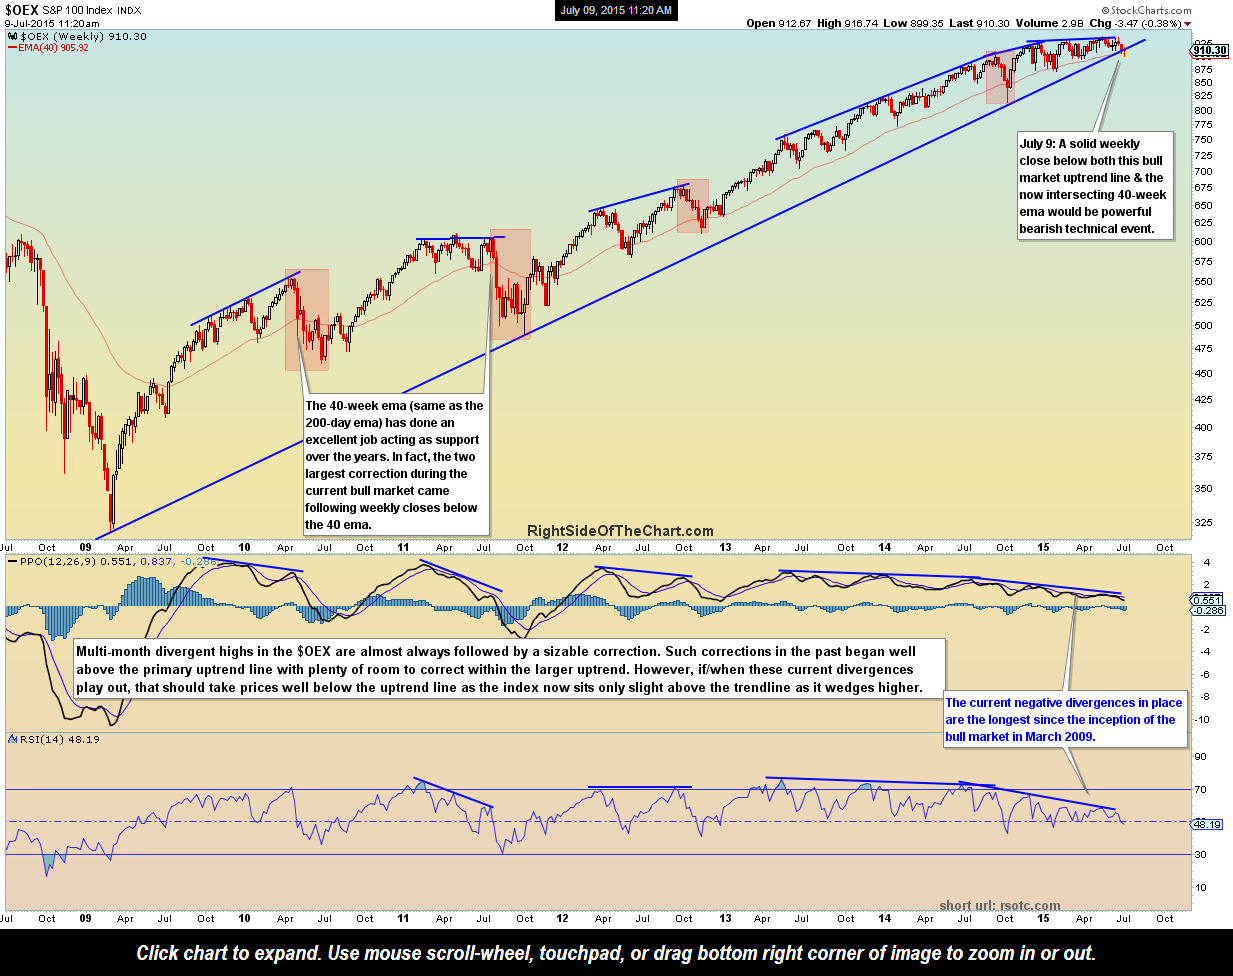
- $OEX weekly 2 July 9th
-
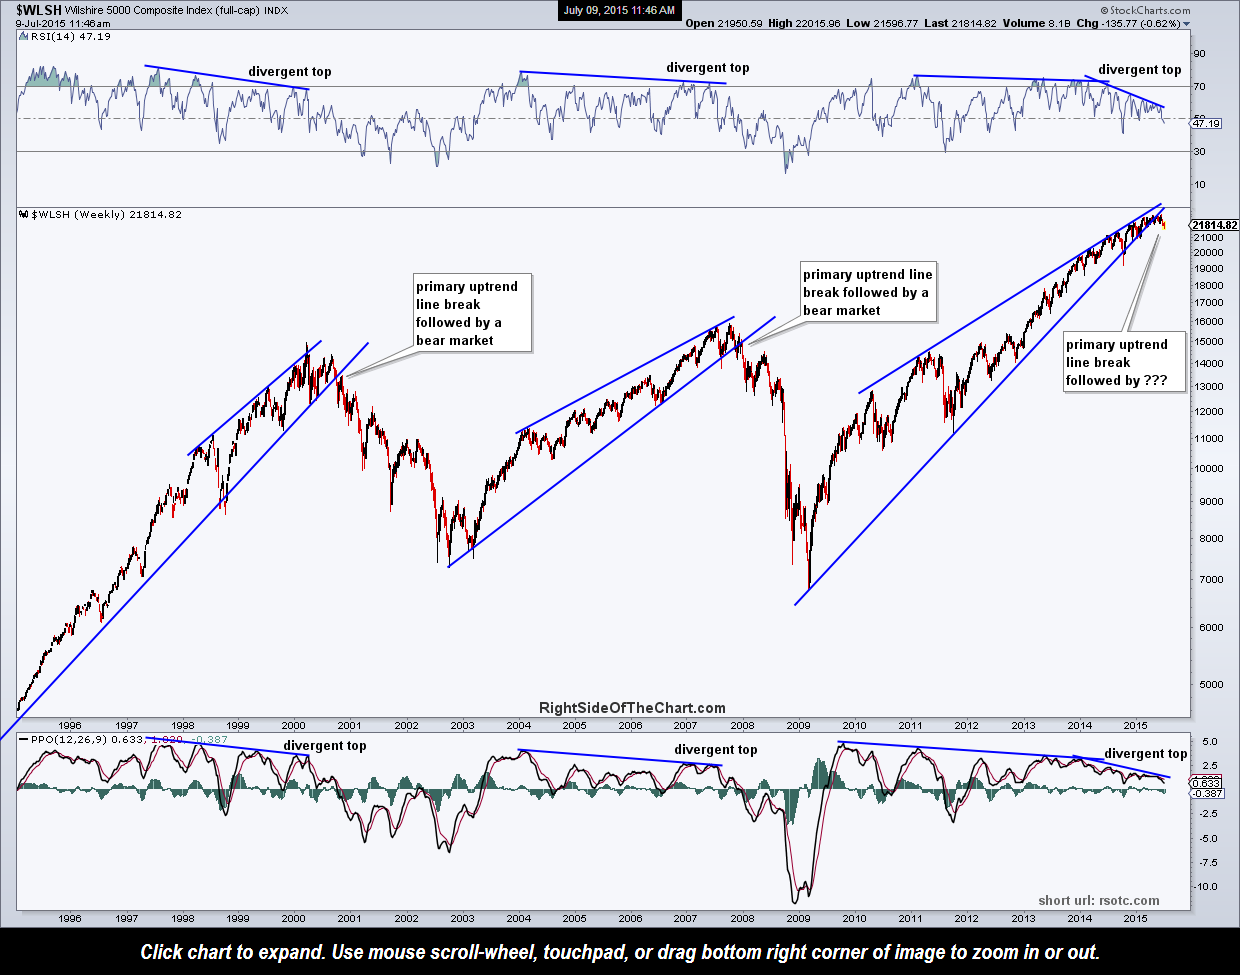
- $WLSH weekly July 9th
-
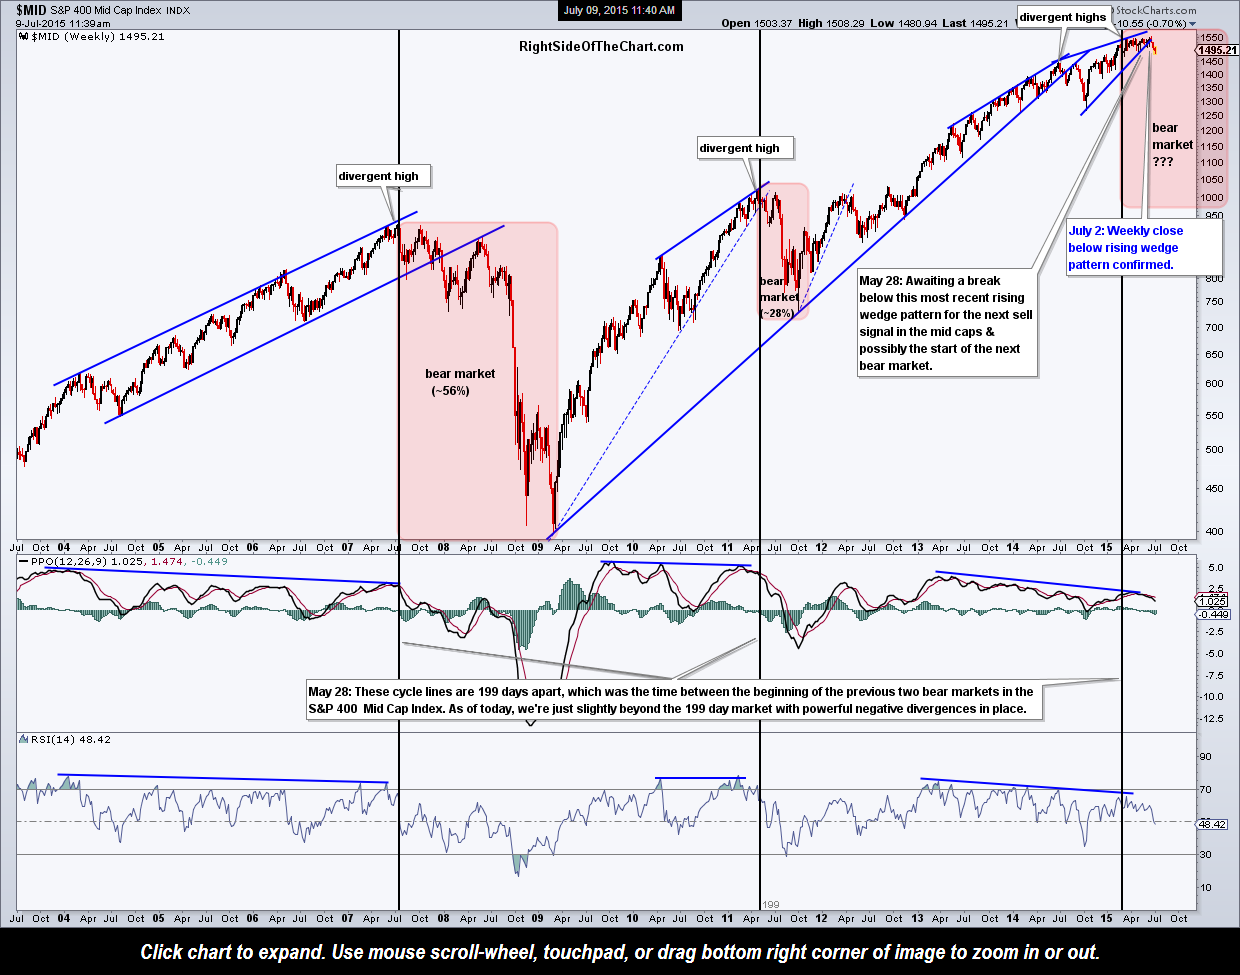
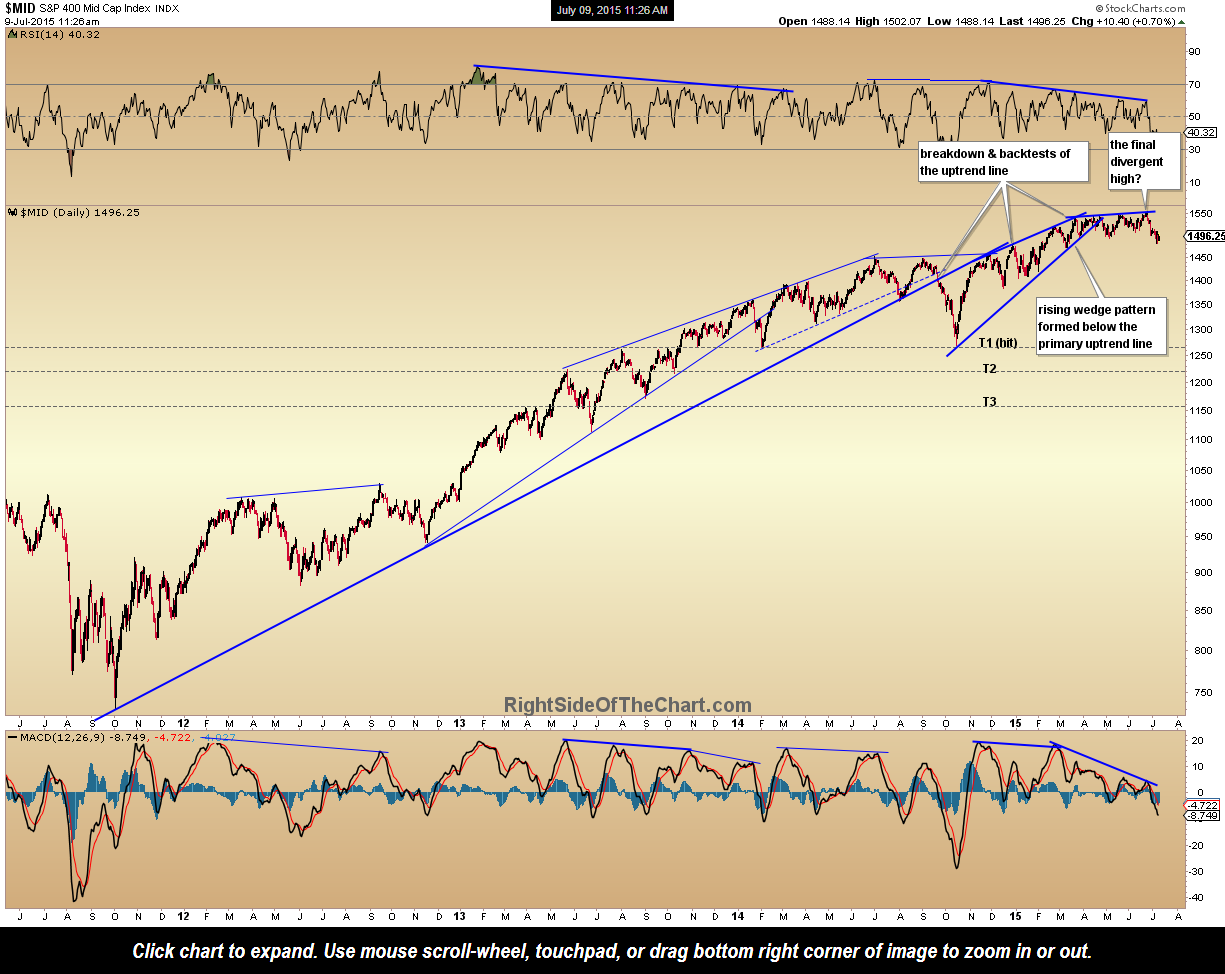
- $MID weekly July 9th
-
- $MID daily July 9th
-
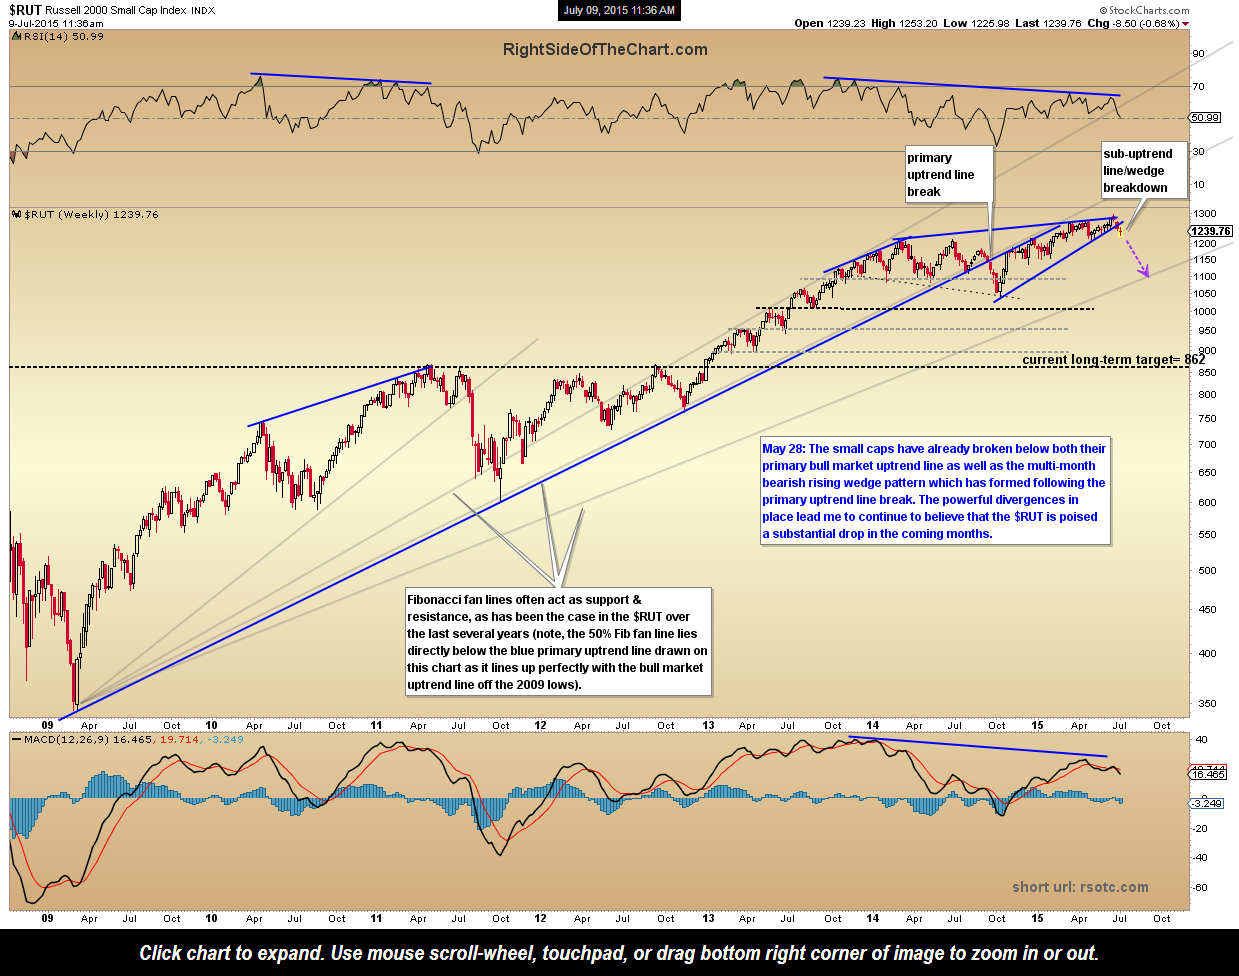
- $RUT weekly July 9th
-
- $SML weekly July 8th

-
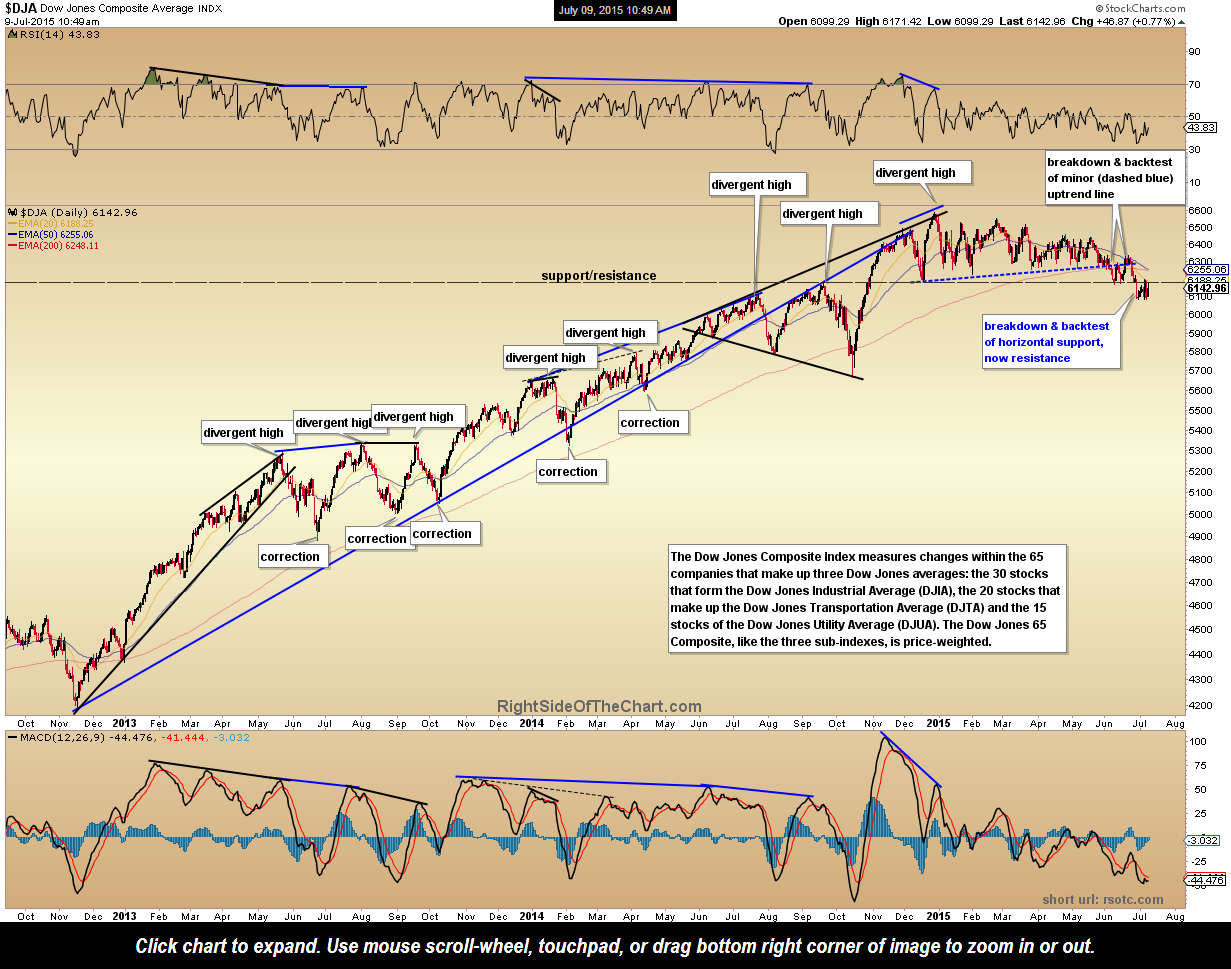
- $DJA daily July 9th