
There haven’t been any significant developments to discuss on the broad markets for month now, hence the reason for my lack of commentary on the US stock indices. Thanks in part to MSFT, we’re finally getting the first half-decent sell-0ff in a while although the price action so far today, for the most part, is relatively insignificant from a technical perspective.
-

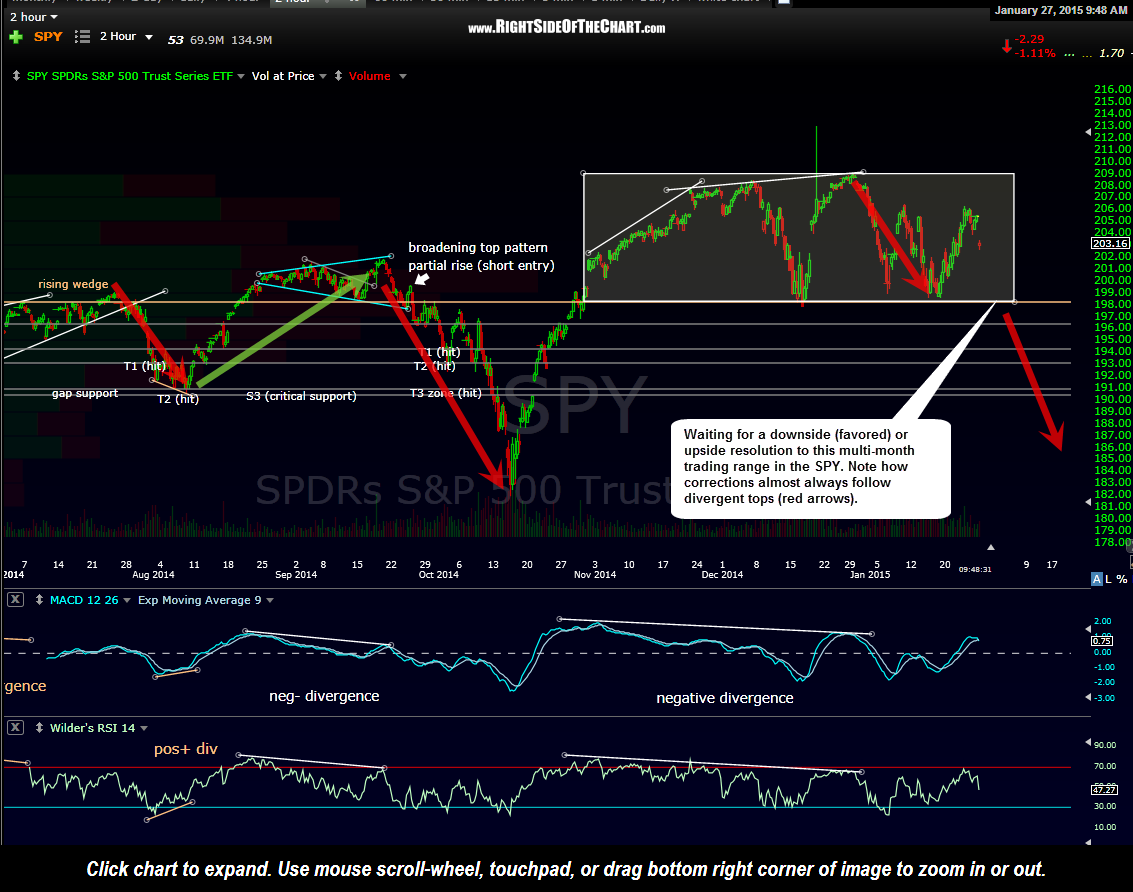
- SPY 2 hour Jan 27th
-
- $SPX daily Jan 27th

-
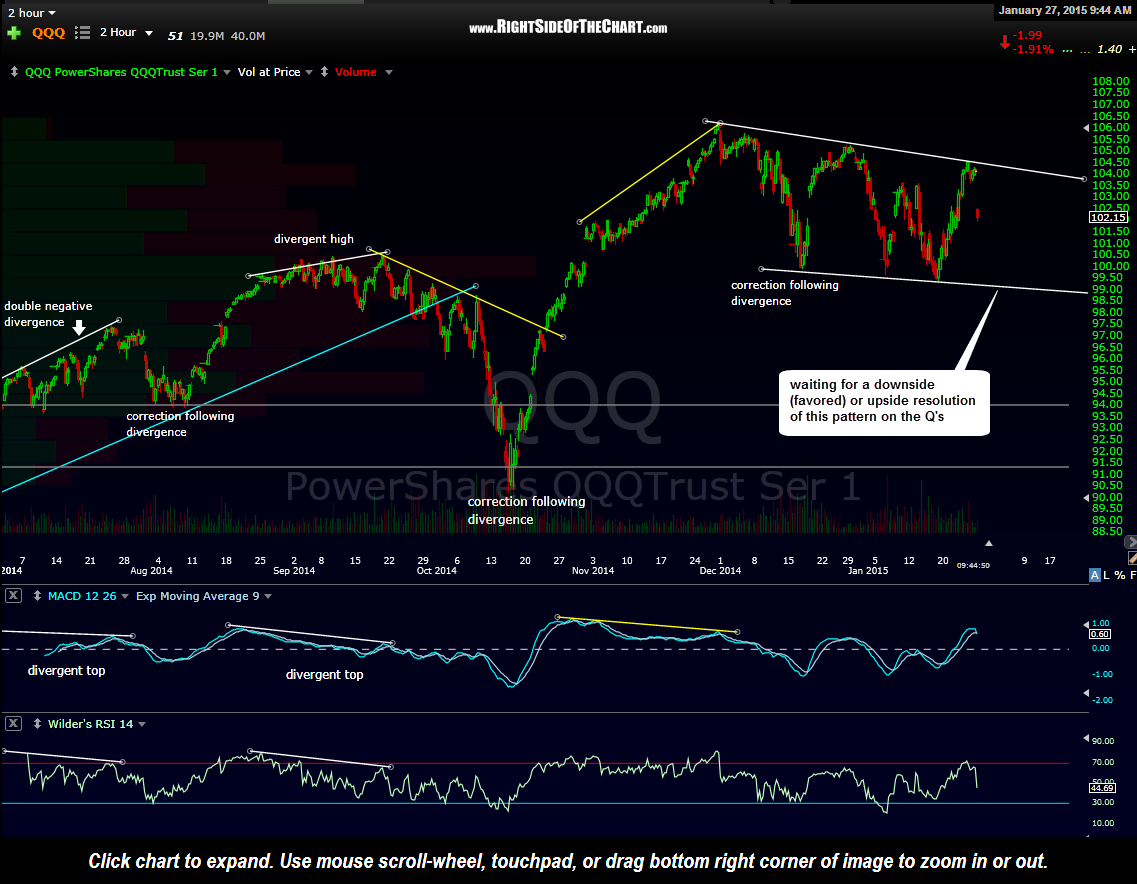
- QQQ 2 hour Jan 27th
-
- $NDX Jan 27th

The charts above show the 2-hour & daily time frames of the $SPX/SPY (S&P 500) and the $NDX/QQQ (Nasdaq 100), highlighting the recent trading ranges & key technical patterns on both. As with all other recent divergent highs on the 60-120 minute time frames in these leading US equity indices, prices have moved lower since the most recent divergent highs (late Jan on the $SPX & late Nov for the $NDX) and based on the technical posture and some recent developments on both the daily & weekly time frames, my expectation is for additional downside in both the $SPX & $NDX before moving above those recent & all-time highs. However, from a pure risk/reward perspective, the most objective short (or long) entry would come on a solid resolution (breakout below or above) the patterns/trading ranges highlighted on the 120-minute charts. As always, links to the live $SPX & $NDX daily charts are accessible on the sidebar of the homepage as well as the Live Charts page of RSOTC (found on the top menu bar).