
Since my call for a 5% correction in the markets last Friday, my updates have been focused on the intraday charts, specifically the 120-minute charts. However, it is always crucial to keep an eye on all time frames of any stock, sector or index that you are trading. Below are the updated daily charts of the $SPX (S&P 500), $NDX (Nasdaq 100) and $RUT (Russell 2000). Currently, prices on all of these major US indices sit right on or just below key uptrend line support, which is also the bottom of large bearish rising wedge patterns. The are the same wedge patterns that have been drawn on these charts for weeks or months now although I did modify the downside price targets on each index today.
-

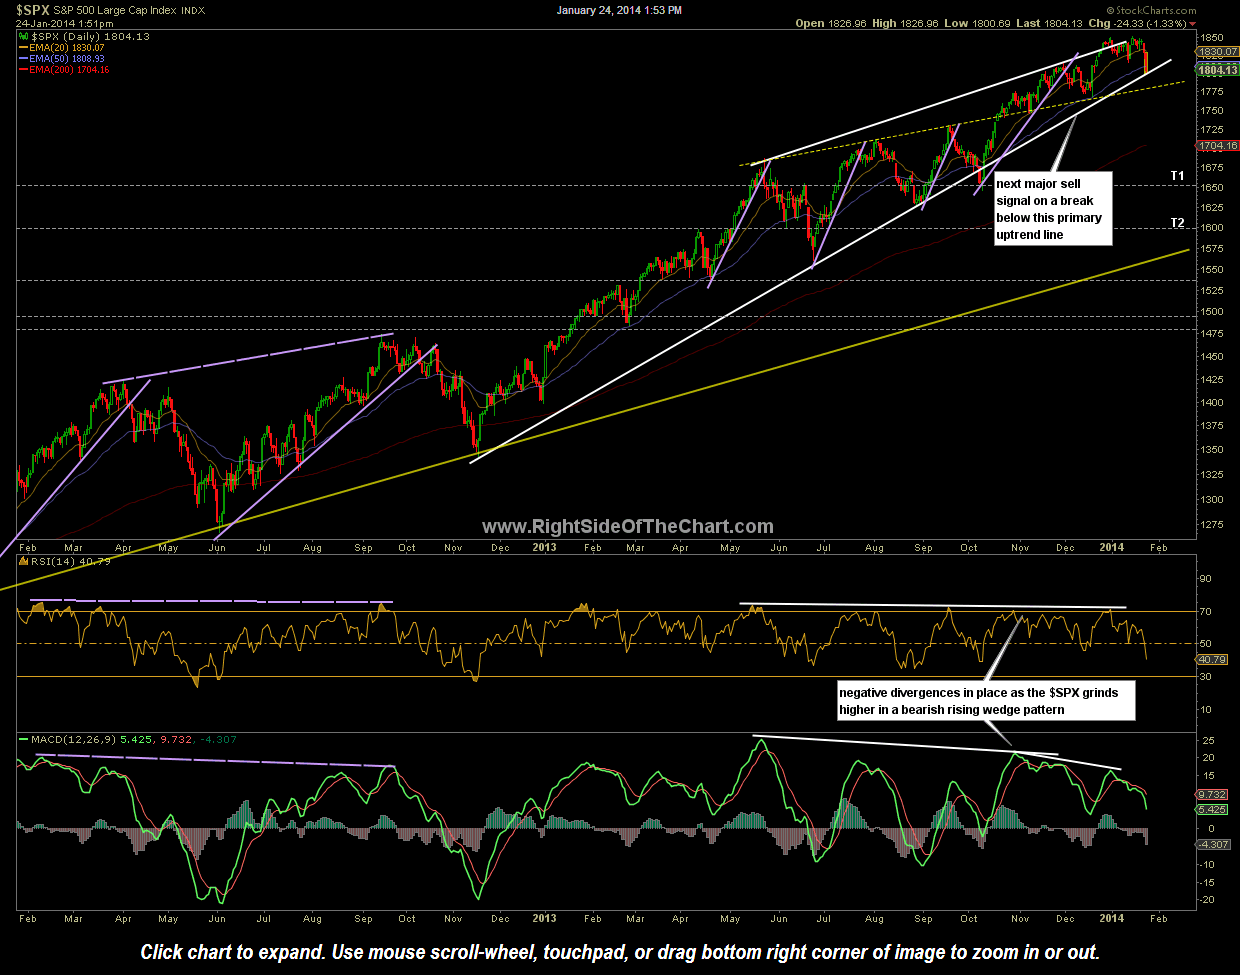
- $SPX daily Jan 24th
-
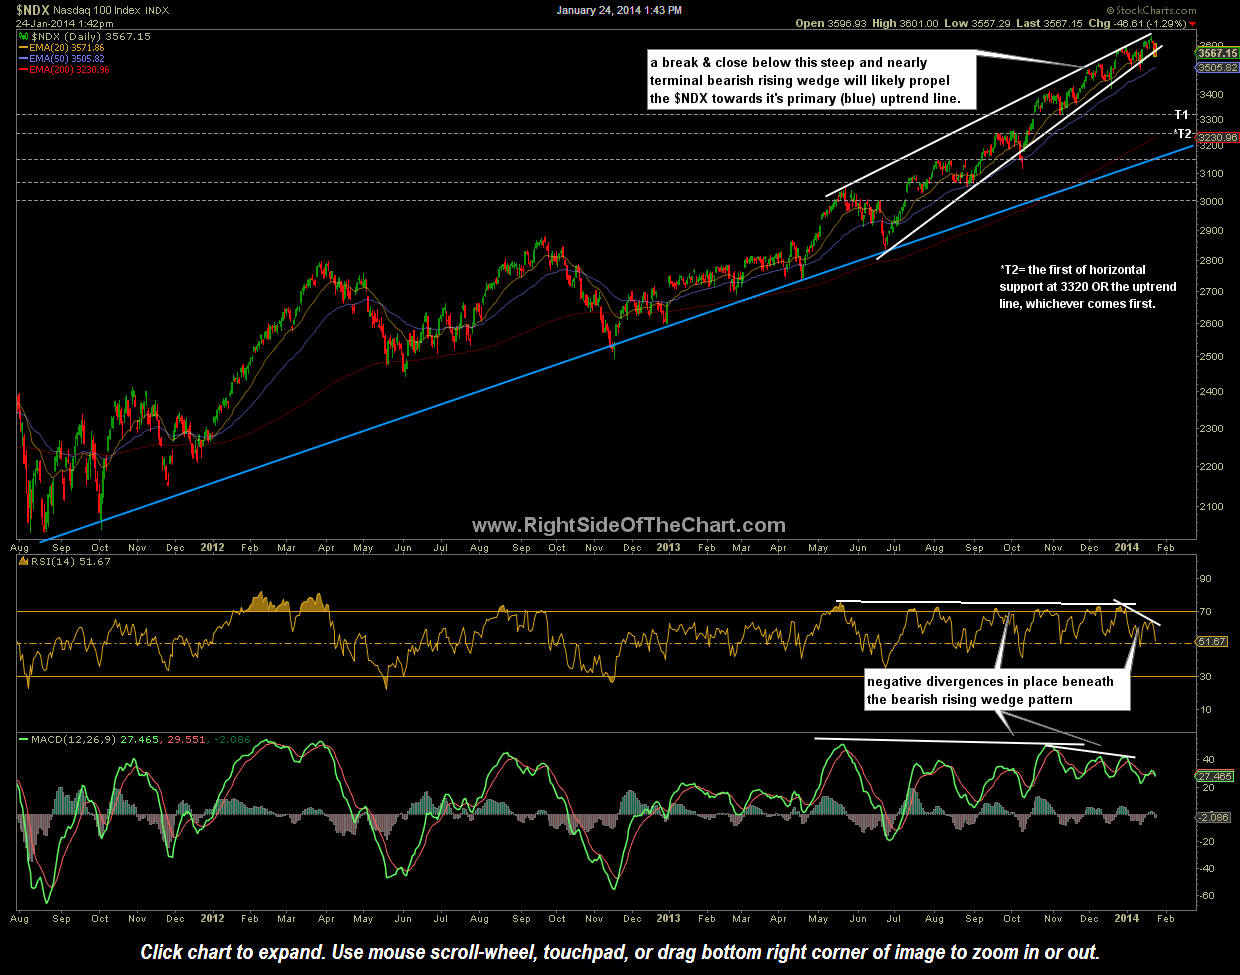
- $NDX daily Jan 24th
-
- $RUT daily Jan 24th

The point here is that should the markets reach my 5% correction target based on the intraday charts, that would trigger a much more significant sell signal on the larger (daily) time frames, likely leading to a much larger correction in the US equity markets. One possibility would be for the SPY to go on to hit one of both of my near-term targets (T1 & T2 at 177.50ish & 175ish on the SPY 120 minute charts), which would clearly bring prices below the daily rising wedge pattern, then a bounce to backtest the wedge from below before moving sharply lower towards my first price target on the daily time frame. That’s just one of many possibilities but the important thing here is that all major US stock indices are currently testing the bottom of large bearish rising wedge patterns with significant bearish divergences in place. Live versions of these charts are available from the Live Chart Links page.