
There was a healthy discussion in the trading room last night & into today regarding the broad markets & what might appear to be breakouts above the primary downtrend lines in the major U.S. stock indices, along with some charts posted that do appear to show the US markets clearly breaking out above those downtrend lines. Let me share my thoughts (cut & pasted from that discussion thread below) along with my interpretation or draw of those key downtrend lines:
I have what I consider to be the most important index, the $NDX/QQQ as well as the $SPX right at key downtrend line resistance. I can see the alternative downtrend line draws which were taken out recently but when trading or factoring in a breakout, if I can draw more than one trendline or horizontal R level in close proximity, I will always err to the side of caution by waiting for the last (upper-most) R level or TL to be taken out, ESPECIALLY when the lower levels were not taken out with conviction (i.e.- impulsive buying & above avg. volume), such as has been the case recently as these alternative TL’s were taken out. I’ll post some charts soon. (end trading room comments).
Should the $SPX manage to break above the downtrend line & take out this previous reaction high, it will have done so while making a divergent high and likely on low volume to boot… the 2 largest factors of failed breakouts.
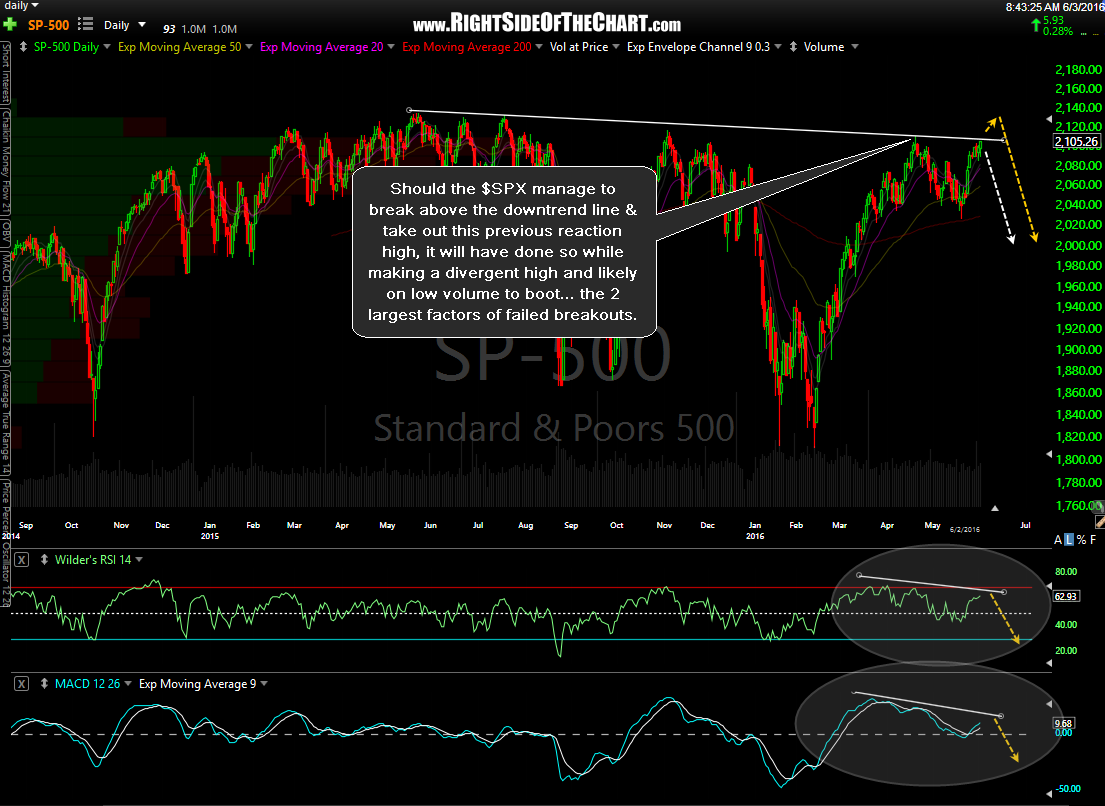
$SPX daily June 2nd close
On the Nasdaq 100, the “New Year’s Gap” remains a very significant resistance level that has yet to be taken out in the leading index. Even if the NDX manages to take out the primary downtrend line & challenge the previous reaction high, it will do so with negative divergence in place.
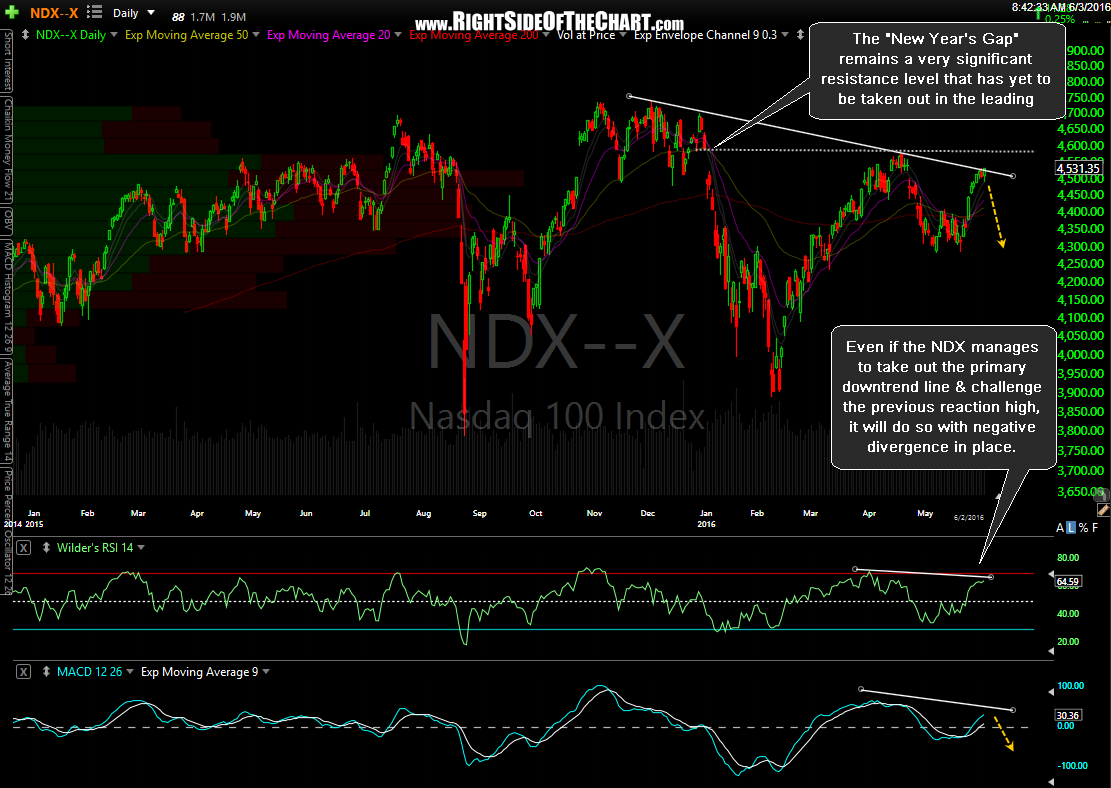
$NDX daily June 2nd close
While these downtrend lines may very well get taken out with the broad markets going on to burn through the potential negative divergences & going on to new highs, until & unless that happens, nothing that I’ve seen in the charts over the last several weeks has changed the longer-term technical picture for the markets although I will say that the near-term & intermediate-term charts, including most of my trend indicators, are a mess right now (i.e.- very unclear with numerous recent whipsaw signals & erratic price action on low volume which calls into question some of the recent short-term bullish technical developments).
Big miss on the employment numbers today with an initial bearish reaction from stocks & bullish spike in gold/GDX. With it being Friday, best to wait until this post-employment noise subsides (next week) before doing much as breakouts & breakdowns are likely to have an increased rate of failure right now.