
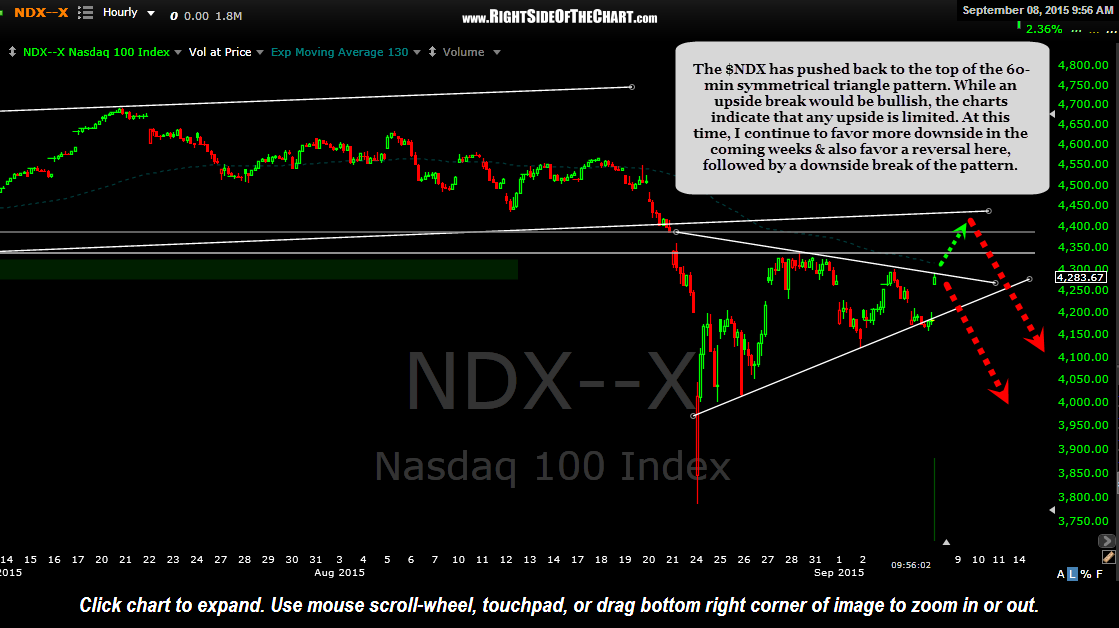
The $NDX has pushed back to the top of the 60-minute symmetrical triangle pattern. While an upside break would be bullish, the charts still indicate that any upside is limited. At this time, I continue to favor more downside in the coming weeks & also favor a reversal here, followed by a downside break of the pattern. ($NDX chart used due to the distortions in the Aug 24th candlestick on the QQQ).
-

- $NDX 60 minute Sept 8th
-

- SPY 60 minute Sept 8th
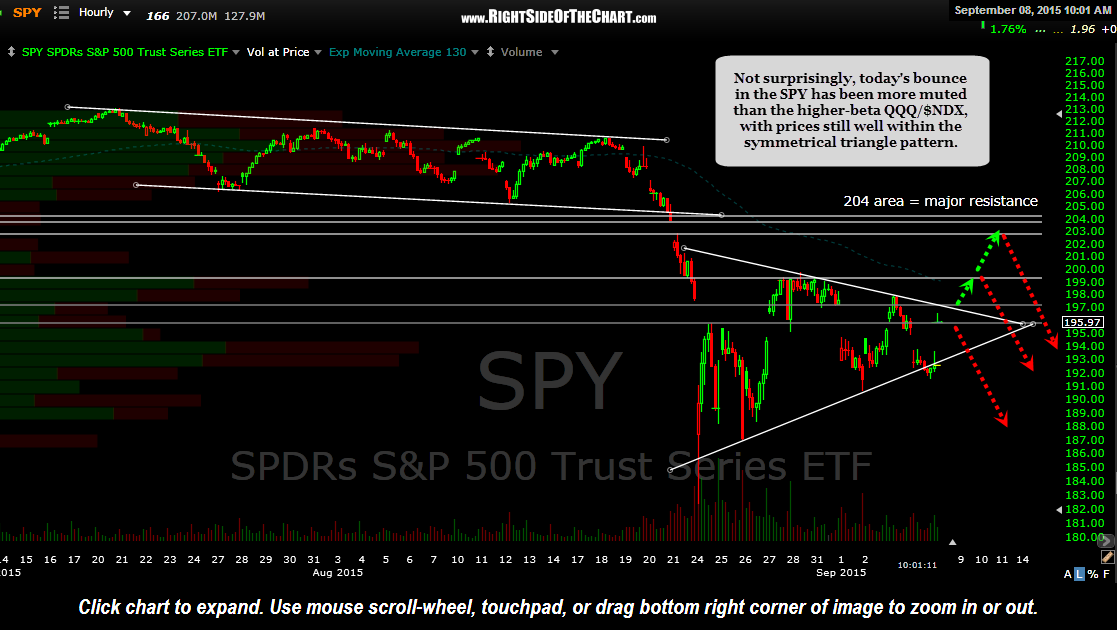
Not surprisingly, today’s bounce in the SPY has been more muted than the higher-beta QQQ/$NDX, with prices still well within the symmetrical triangle pattern. As I’ve been stating for weeks, due to the massive overhead supply in addition to many other recent technical developments (bull market trendline breaks, bearish trend indicators, etc…), I believe that the upside potential for US equities is relatively limited in comparison to the downside risk. Such a highly volatile, sideways market works in the favor of some of the recent Active Short 3x leverged bullish ETFs like LABU & FAS, even if the market ends up going nowhere. Until a definitive resolution of these 60-minute triangle patterns, the recent back & forth large price swings will likely continue although these triangles should break any time now.