
The leading index, QQQ/$NDX, broke down below the multi-month trading range on impulsive selling today which opens the door to a move down to the T2 level. T1/S1 is now key resistance which would provide an objective level to initiate or add to short exposure, should the Q’s backtest it.
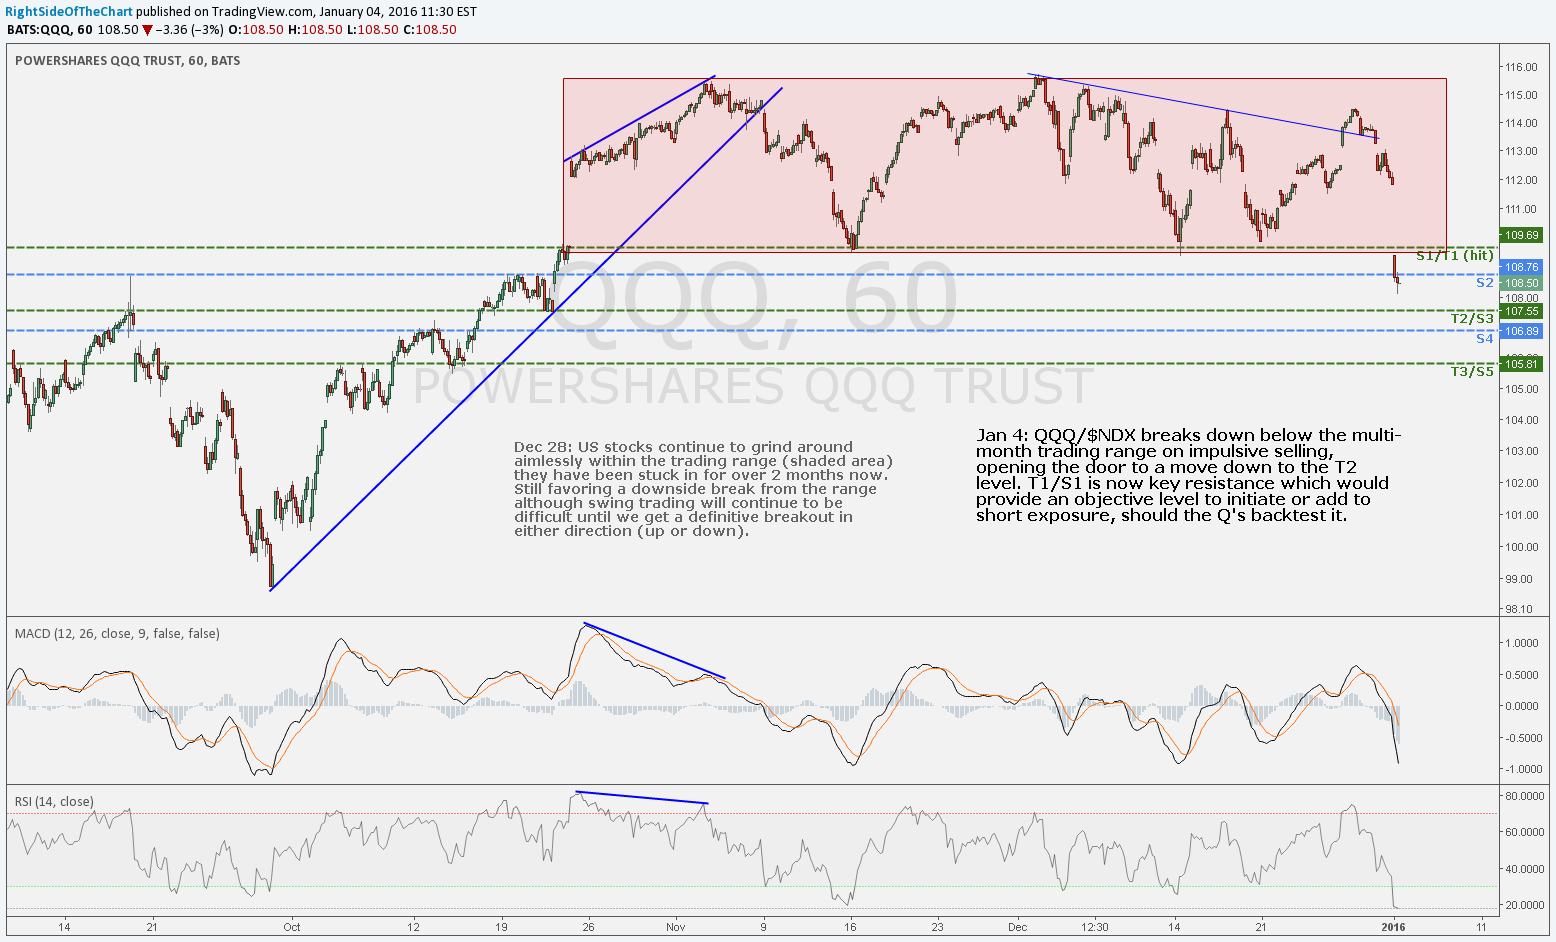
QQQ 60-minute Jan 4th
The $VIX has been in an uptrend since late October & is currently testing resistance (R1) defined by the two previous reaction highs. Any break above the R2 level will likely coincide with a melt-down (impulsive selloff) in US equities).
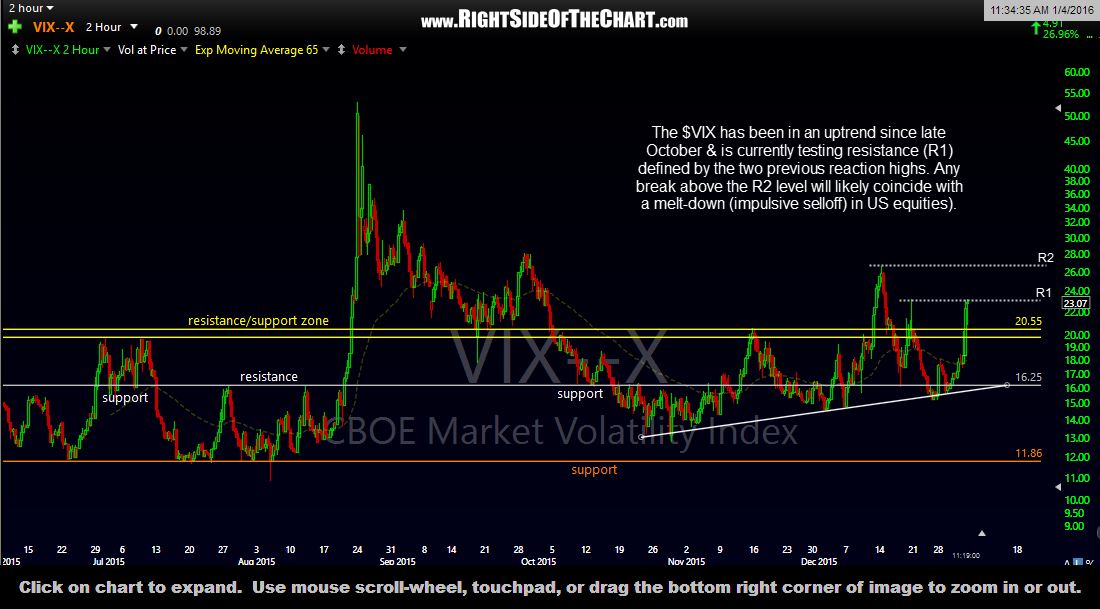
$VIX 120-minute Jan 4th