
In this post published a week ago today, the very tight correlation between the US Dollar and US equities was highlighted along with some bullish developments in the EUR/USD currency pair. Shortly after that post, the EUR/USD went on to make a successful breakout & backtest of that 60-minute falling wedge pattern and has climbed steadily since. The Euro is by far the largest component of the US Dollar index so EUR/USD moving higher = a decline in the US dollar.
-

- EUR-USD 60 minute Sept 11th

-
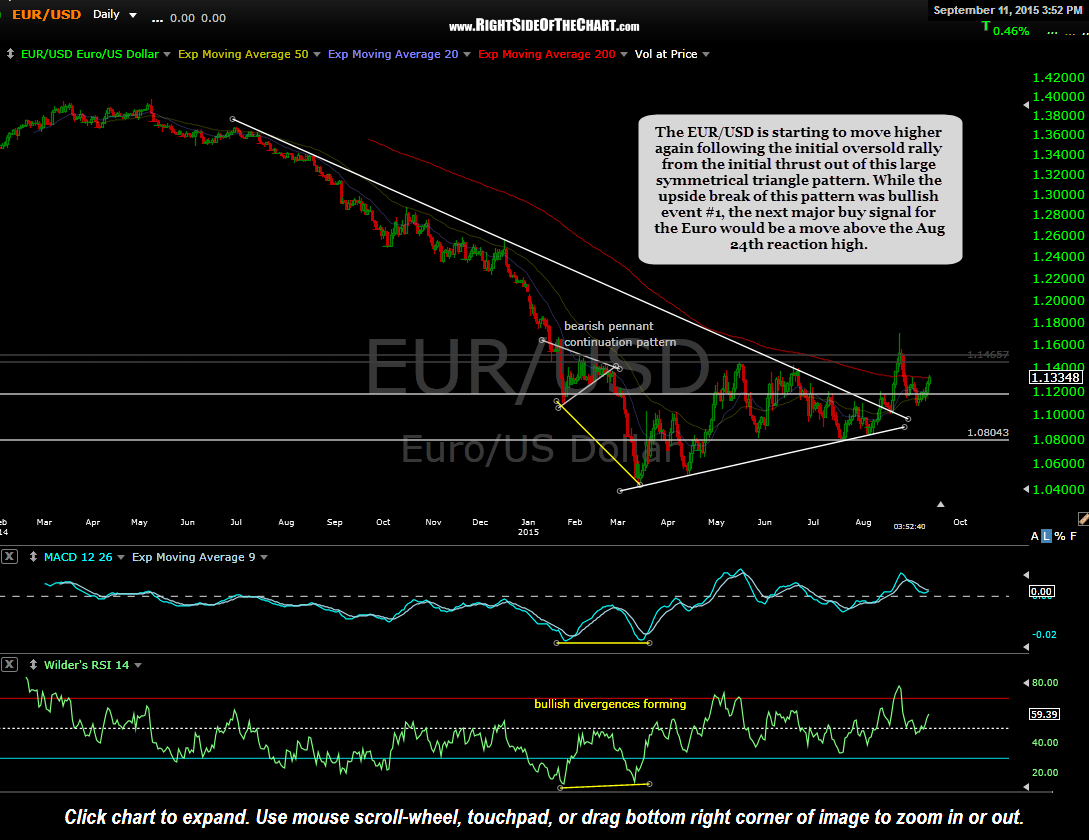
- EUR-USD daily Sept 11th
-
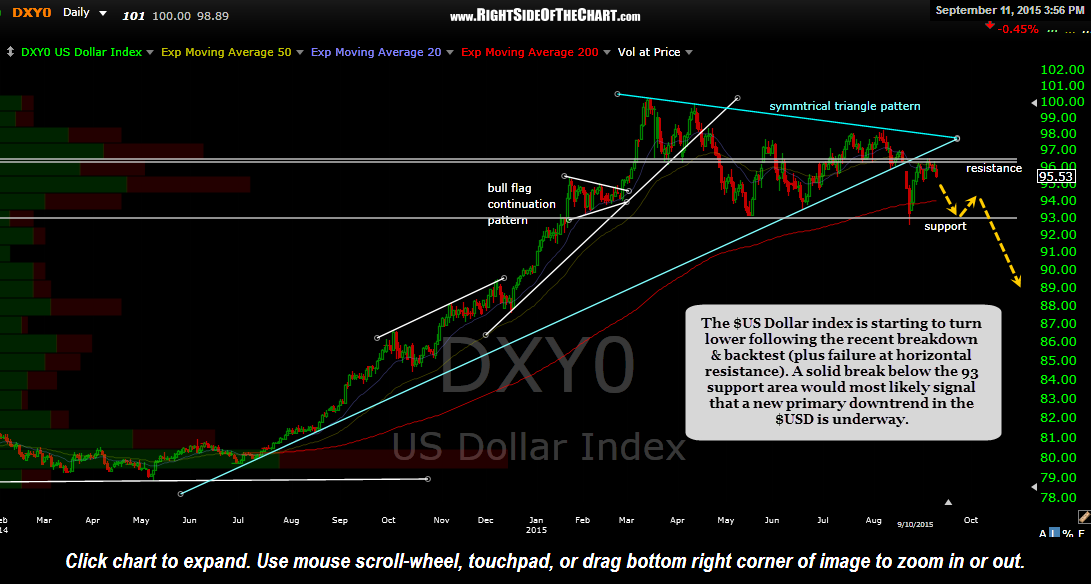
- $DXY daily Sept 11
-
- UUP vs. SPY Sept 11th

Despite the recent fall in the $USD/rise in the Euro, U.S. equities closed today around the same levels where they were following the breakout which occurred at the start of this week. However, as the 10-minute period chart of SPY vs. UUP shows, the nearly perfect correlation between the has completely disconnected since Thursday morning. Although temporary disconnects of the correlation between stock prices & the $USD are not unusual, a reversion to the mean is likely to occur next week which can manifest in one of three ways:
- Stocks begin to move lower as a result of the falling dollar (which is likely to benefit commodities).
- The current near-term downtrend in the dollar reverses, with the dollar rebounding, most likely lifting stocks in the process.
- Or we get a combination of the two (a mild pullback in stocks along with a strengthening dollar.)
Other than glancing at the relatively flat market a few times today, I have been preoccupied working on some improvements to the site which I hope to roll out soon. I’ll take a look at the charts over the weekend and post any market analysis or trade ideas that look compelling. Have a great weekend.
-RP