
To expand on my thoughts and analysis covered in the GDX & GLD Outlook video posted earlier today, I wanted to share my reply to a question posted under the comments section of that post.
Q: Hi Randy, I am enjoying your blog. This is my first post. I just watched your Gdx video. You posted that if Gdx makes a flush out move to the downside and gold doesn’t, we may see an important bottom. How far do you see this flush out move going on Gdx, if this scenario transpires?
R: hard to say but I think a move down to around the 12.00 level in GDX, assuming the 13.00 support goes (just over a 7% drop below 13.00) would be commensurate with a wash-out move in the miners. Heck, with the trading history of GDX, that would only be just one really bad day or two average bad days in GDX so even a move well below 12, assuming that GLD hangs in there, is certainly a possibility.
On a related note, I wanted to keep the video as brief as possibly so I didn’t go over currencies but IF that wash-out move in GDX (and we could possibly even see one in gold) does occur, it will almost certainly coincide with a breakout in the $DXY/$USD (US Dollar Index) which has a double-top high/resistance, a breakout of which would almost certainly come in right around a breakdown of the low/support in GDX and/or gold. Sure, such a breakout to new highs in the $USD could stick with a new leg higher & a new leg down in gold but my read on the charts is that any breakdown in GDX and/or gold (as well as a breakout in the $USD) will likely prove to be a whipsaw signal, most likely followed by a powerful & sustained reversal. (end reply)
Here’s the daily chart of the U.S. Dollar Index along with the $DXY weekly chart, which helps to formulate my expectation that any upside breakout in the Dollar will likely prove to be a whipsaw signal (false breakout).

$DXY daily Jan 12th
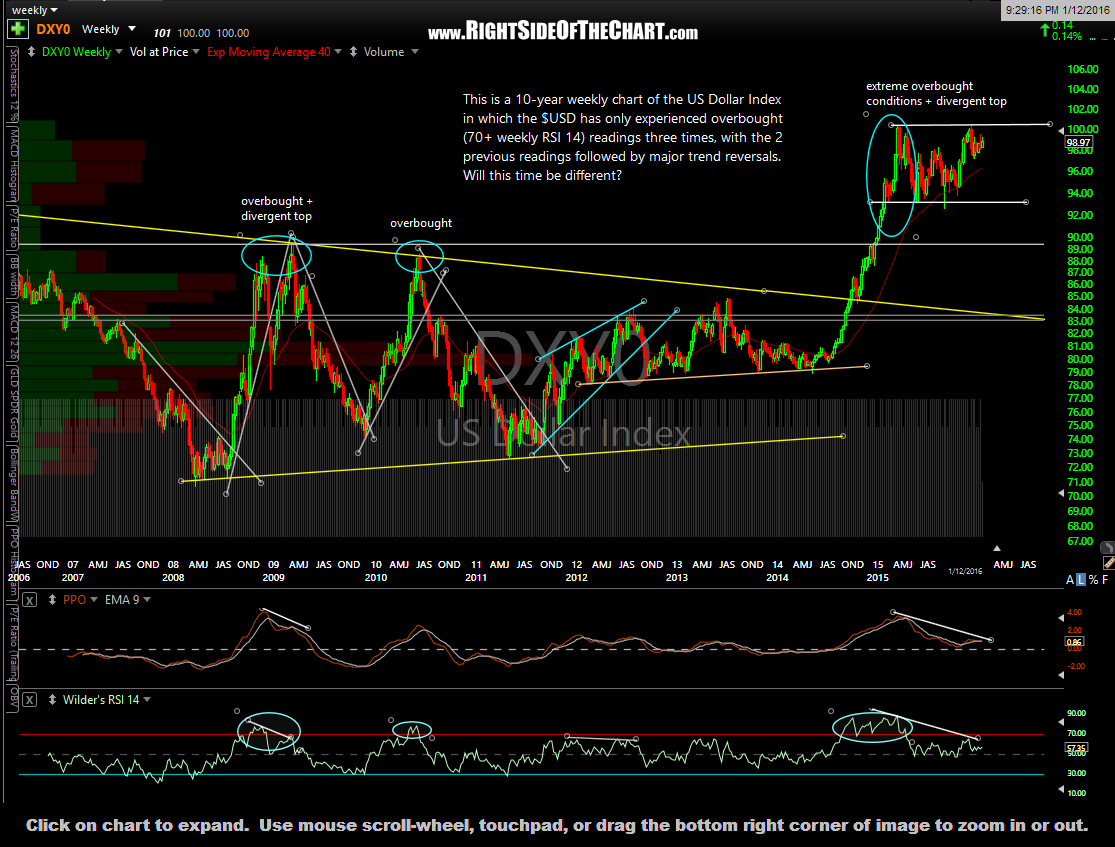
$DXY weekly Jan 12th