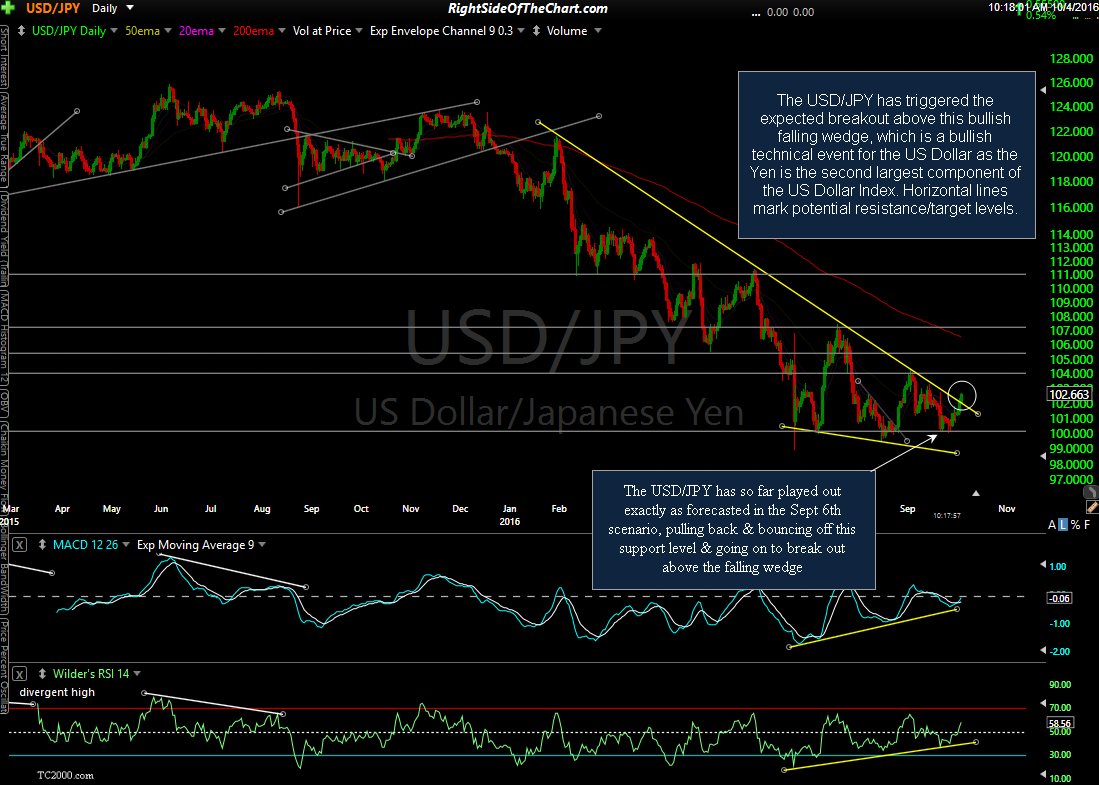
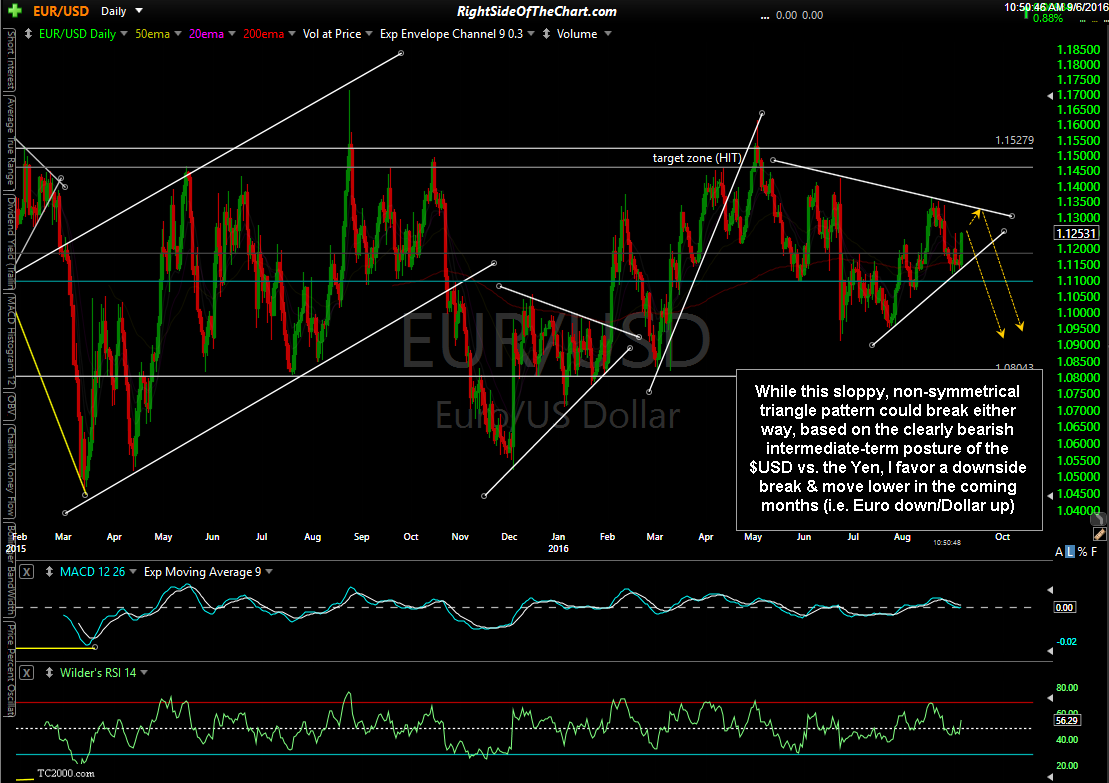
The USD/JPY (Dollar/Yen currency pair) has triggered the anticipated breakout above this bullish falling wedge, which is a bullish technical event for the US Dollar as the Yen is the second largest component (13.6% weighting) of the US Dollar Index. Horizontal lines mark potential resistance/target levels. The USD/JPY has so far played out exactly as forecasted in the Sept 6th scenario (first chart below), pulling back & bouncing off this support level & going on to break out above the falling wedge.
-

- USD-JPY daily Sept 6th
-

- USD/JPY daily Aug 4th
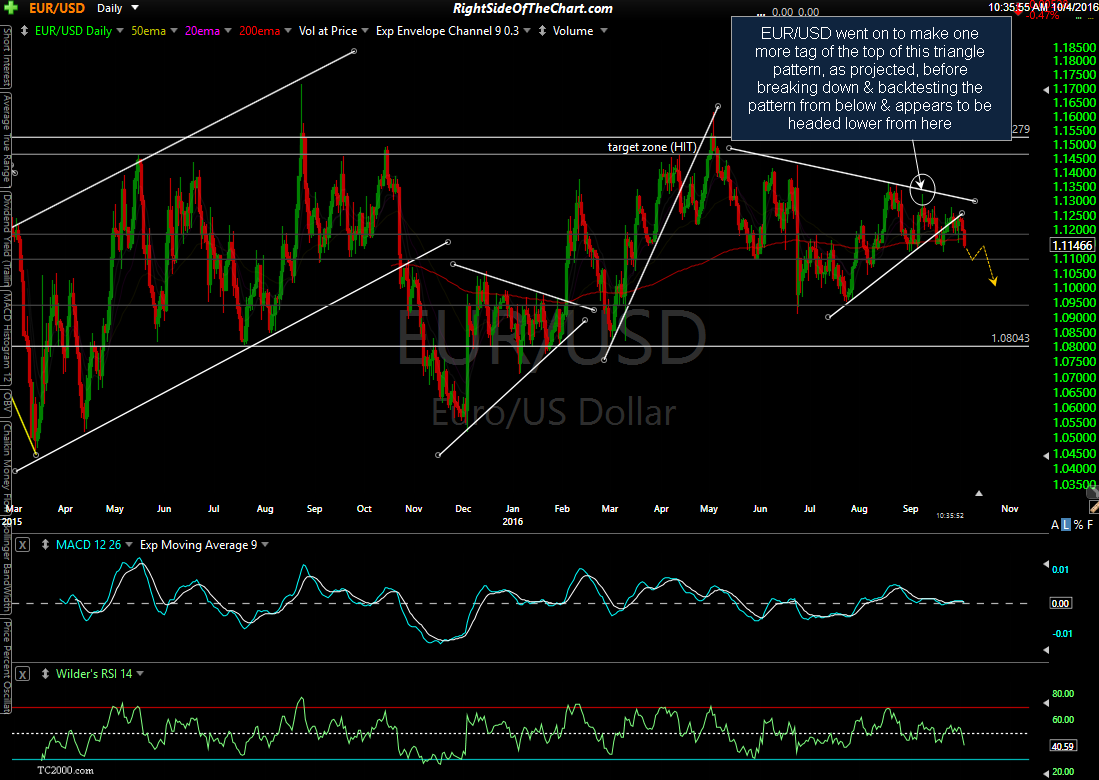
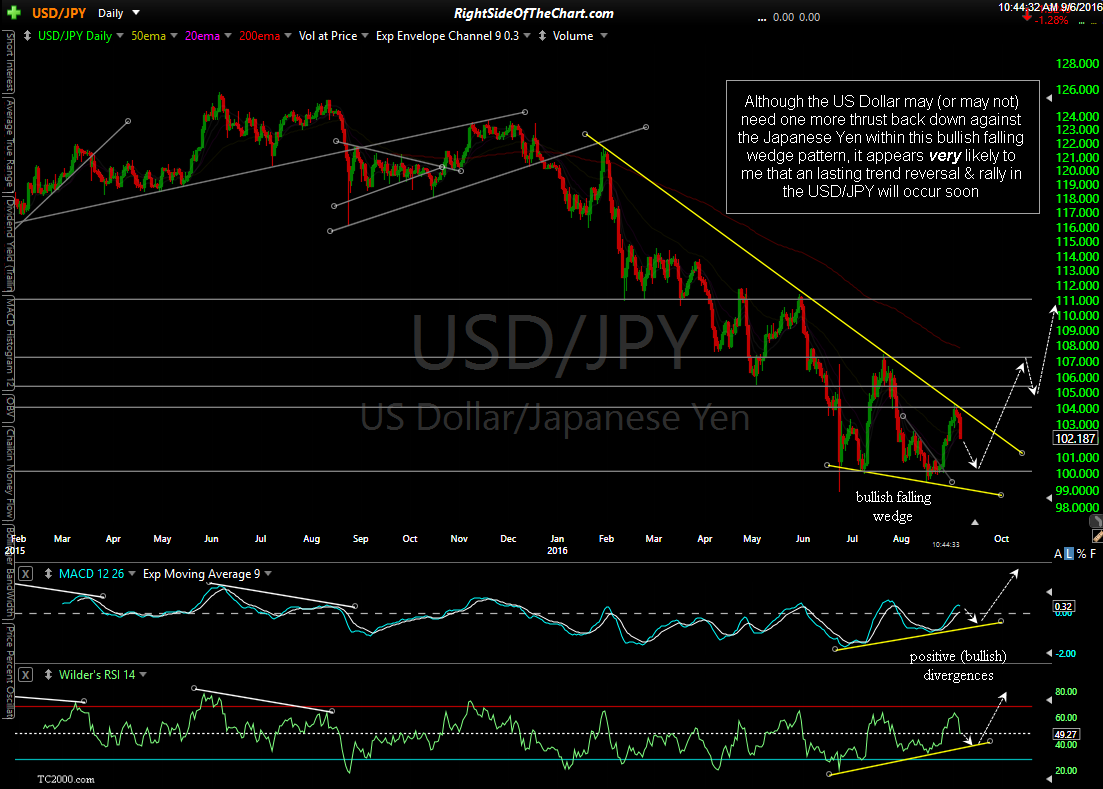
Personally, I don’t trade currencies often although I do keep a close eye on the major currencies when trading the gold, silver & the precious metal mining stocks or any other dollar-sensitive assets. In fact, the first chart above was from the August 4th post titled Do You Want To Know Where Gold Is Going? in which a near to intermediate-term bullish case was made for the dollar, largely based on the outlook for the US Dollar, Euro & Yen. Also included in that post was the following (first) chart of the EUR/USD, which as also forecasted, went on to make one last tag of the top of this triangle pattern before breaking below & backtesting the triangle pattern. The Euro is the largest component of the US dollar index at a 57.6% weighting. As such, these charts seem to indicate further strength in the US dollar in the coming months, barring the typical zigs & zags.
-

- EUR-USD daily Sept 6th
-

- EUR/USD daily Oct 4th