
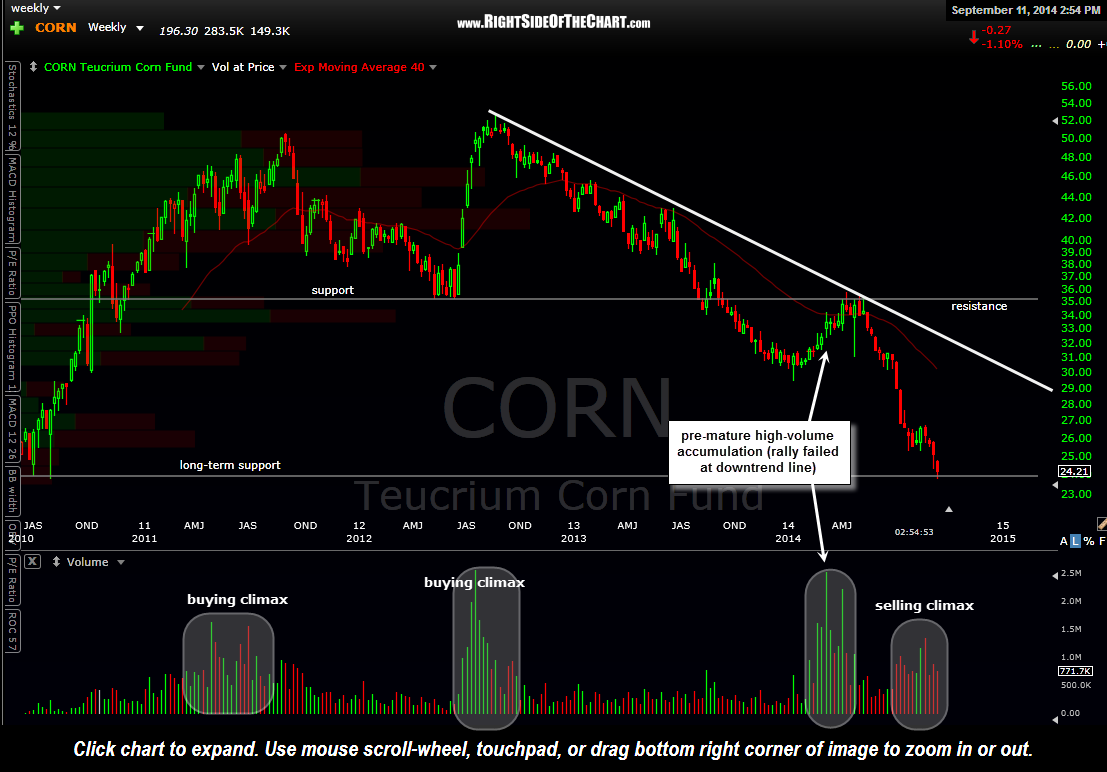
As a follow-up to the previous post with the $CORN (Spot Corn Prices) weekly chart, below is the 5-minute chart of US Corn Futures as well as the weekly chart of CORN (Corn ETF), highlighting the current volume surge which is indicative of a selling climax.
-

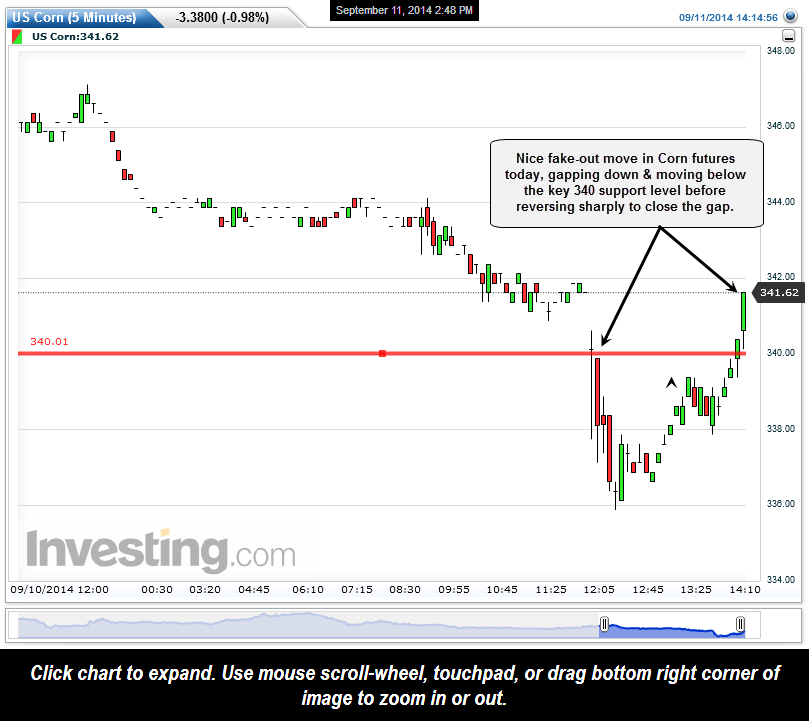
- US Corn futures- 5 min. Sept 11th
-
- CORN weekly Sept 11th
click here to view the live, streaming chart of US Corn Futures. Once the page to Investing.com opens, from the top of the chart select: Instruments/More Instruments & then “U.S. Corn Futures” under the Commodities section.