
Back on August 26th, I became bullish on bonds (i.e.-bond prices up, rates down). While some of the reasoning for a reversal in rates (treasury yields were just a day or two off multi-year highs at the time) was predicated on a flight to safety from a pullback in the equity markets, which has so far not been the case, I remain near-term bullish on bonds and do still believe that a pullback in the broad markets will likely put some more wind in the sails behind a move down to my price targets as shown in these charts.
-

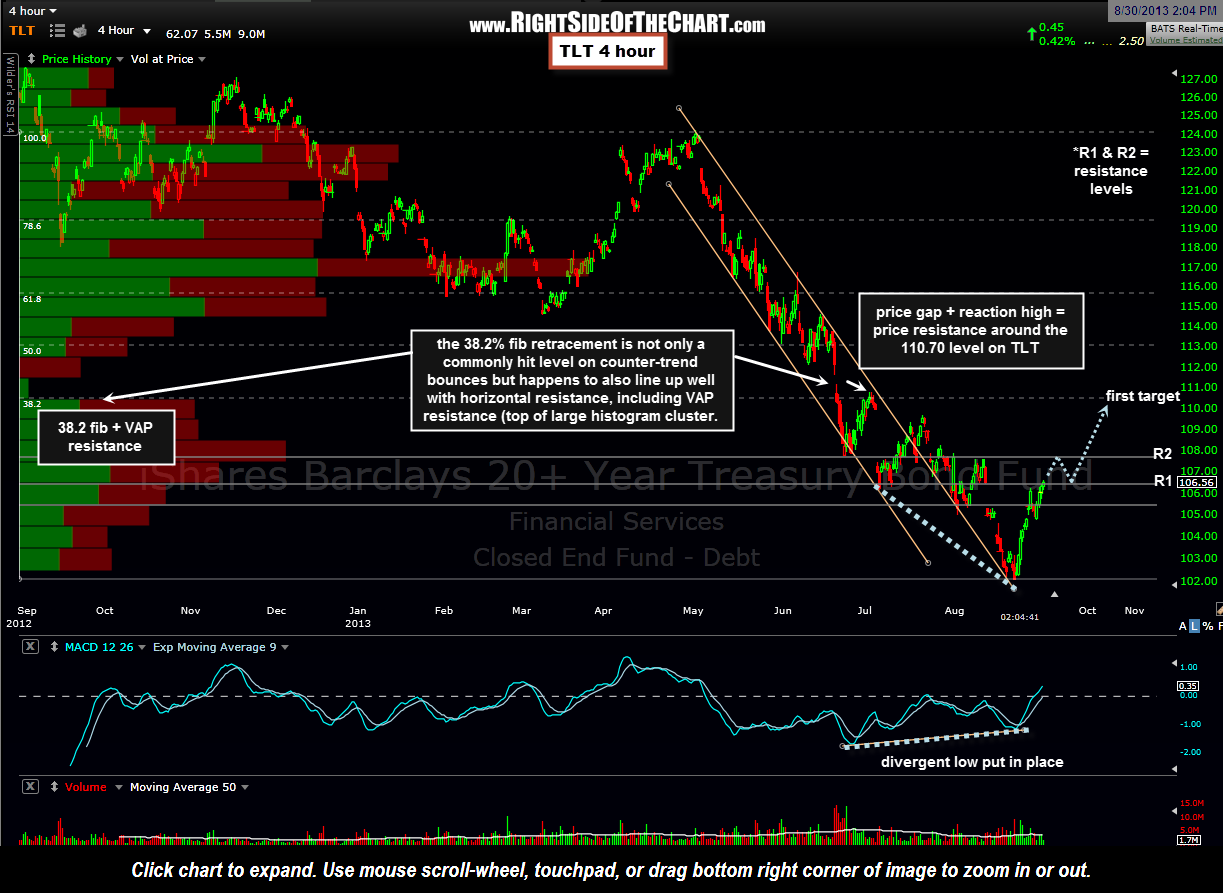
- TLT 4 hour Chart from 8/30/13
-
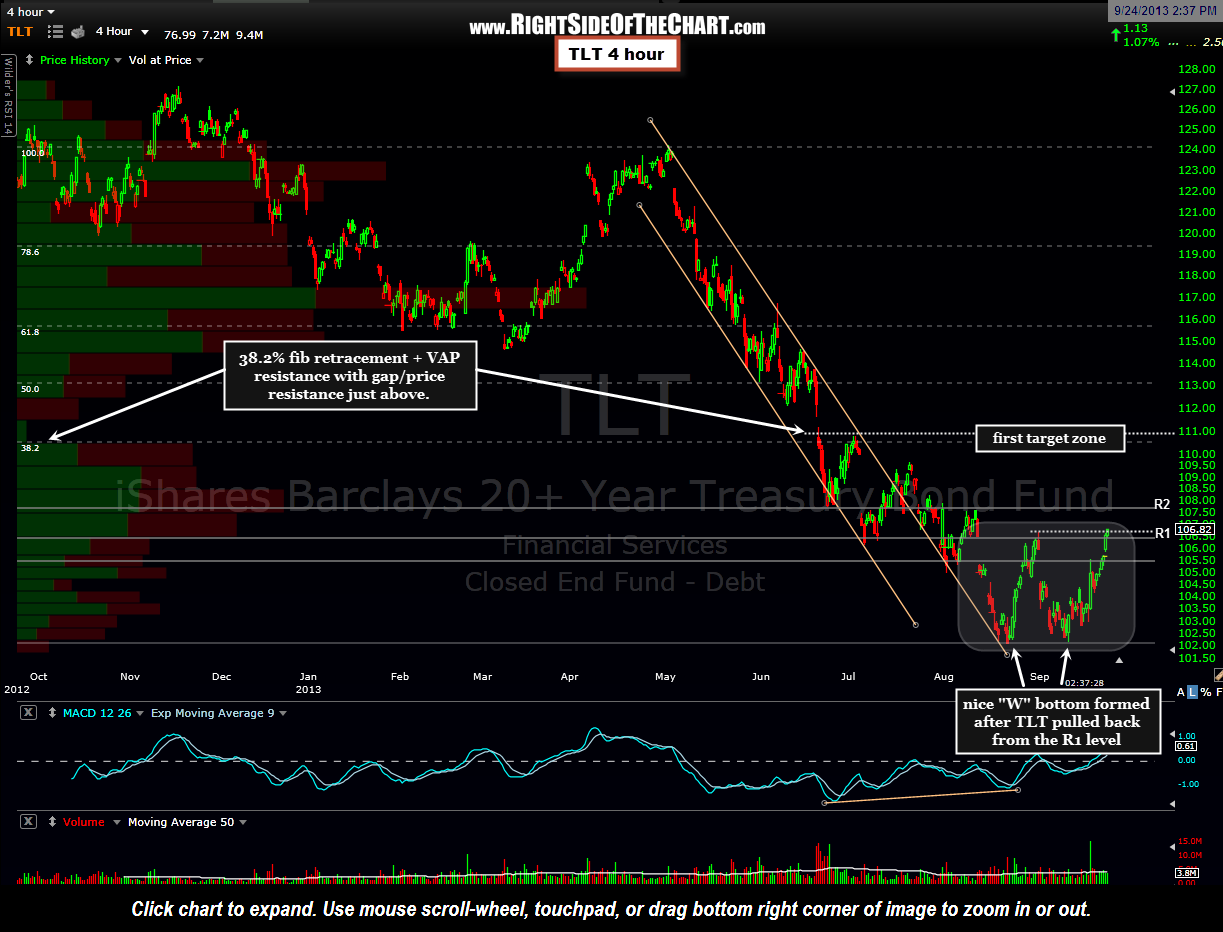
- Updated TLT 4 hour chart
-
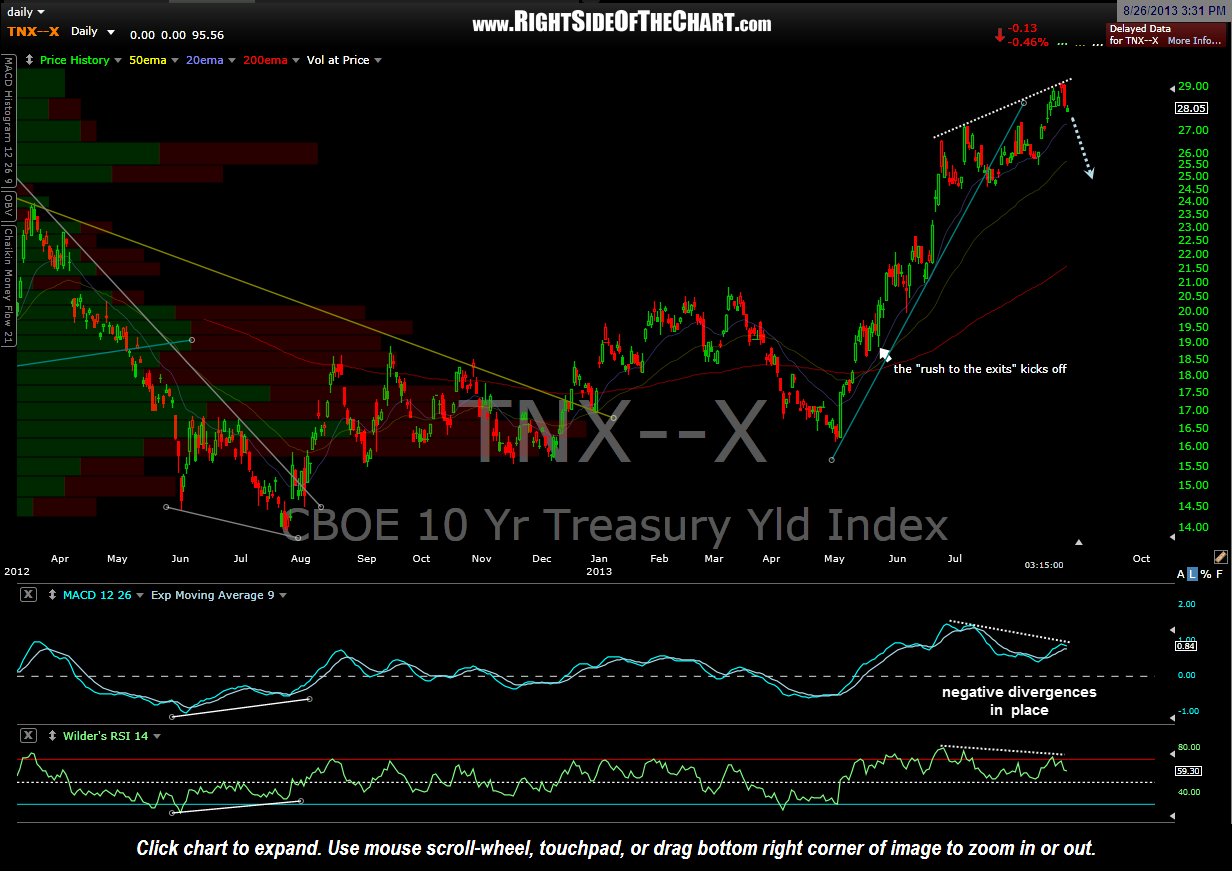
- $TNX daily chart from 8/26/13
-
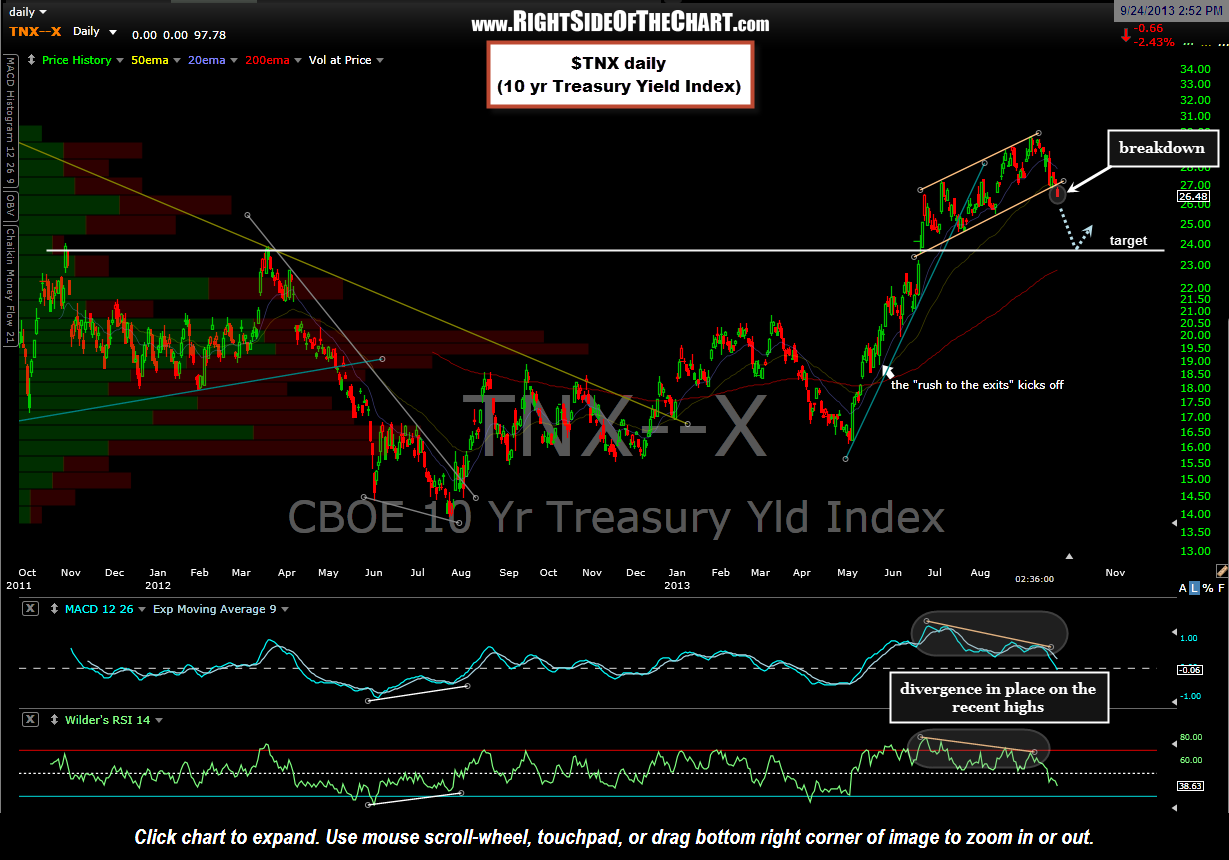
- Updated $TNX daily chart
-
- Updated $TYX daily chart
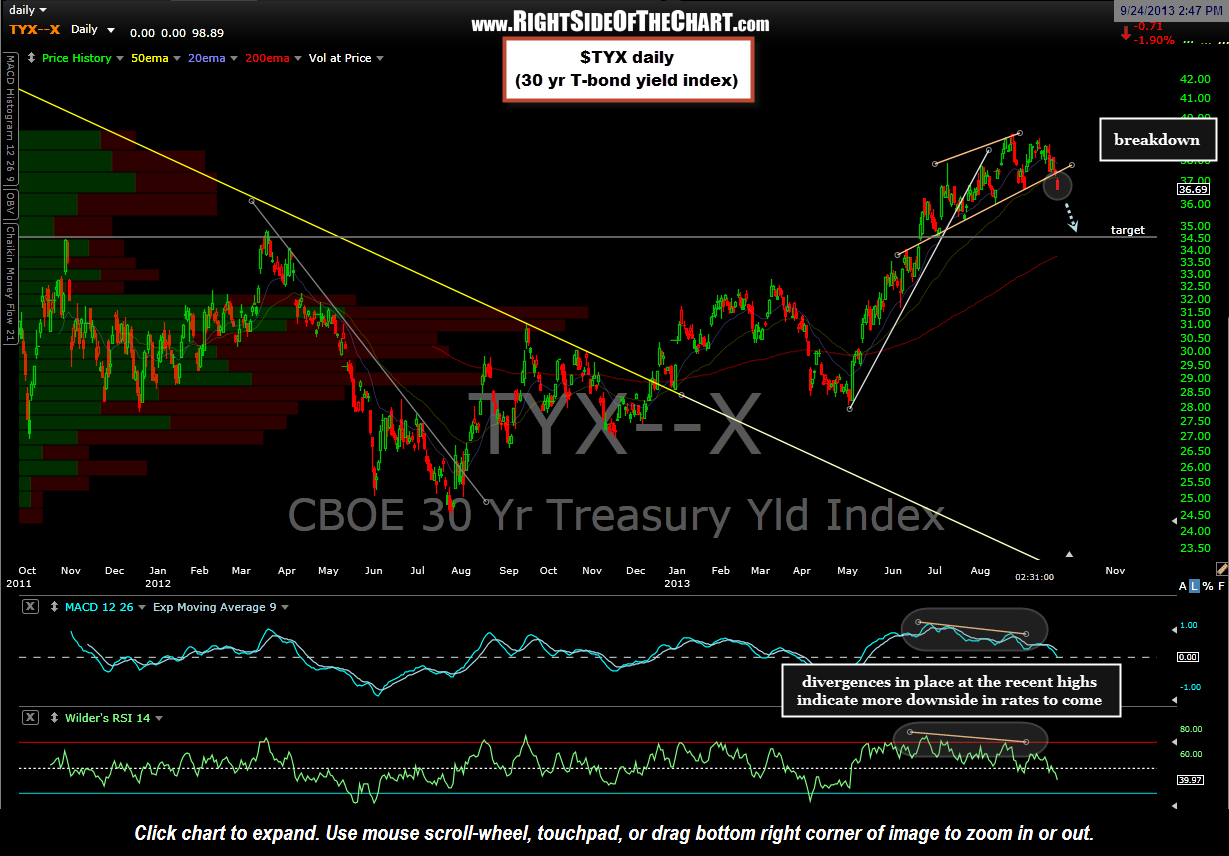
Of course, a large part of the bond prices up/rates down call was and still is based on the technical posture of the treasury charts. The reasoning for today’s update is to point out that we have several key technical breakdowns in treasury rates as shown in the updated $TYX and $TNX charts below. The charts below are in gallery format. Simply click on the first chart to expand & then right click anywhere on the right-hand side of the expanded chart to advance to the next chart in the sequence. Listed above are the 4-hour chart for TLT (20+ Treasury ETF, which shows bond prices), followed by the daily charts of & $TNX (10 year Treasury Yield Index) as well as $TYX (30 year Treasury Yield Index, only one chart as I have there were not any recent charts posted on $TYX) . Each chart is preceded by it’s previously posted version for reference.
What you’ll notice on the TLT 4-hour chart is that prices had run into my first resistance zone (R1) at the time of that previous post about a month ago. I opted to leave out an alternative scenario at the time & had only showed a primary scenario of prices continuing higher before pulling back. As the updated chart shows, prices did pull back from the R1 level and went on to successfully retest the previous lows (bullish) and have since carved out a nice “W” bottoming pattern (potentially bullish). That W pattern will trigger a breakout on any solid break above the top of the R1 zone (which now includes the dotted line to include the previous reaction high). If that level is clearly taken out, my expectations continue to be for a minor reaction at R2 followed by a move up to at least the 110.50-111 area. Other than a possibly trading opportunity in bonds via etfs, futures or options, one would expect that if these scenarios do play out, the trade ideas listed in the new Growth & Income Trade Ideas category should likely benefit from the drop in rates.