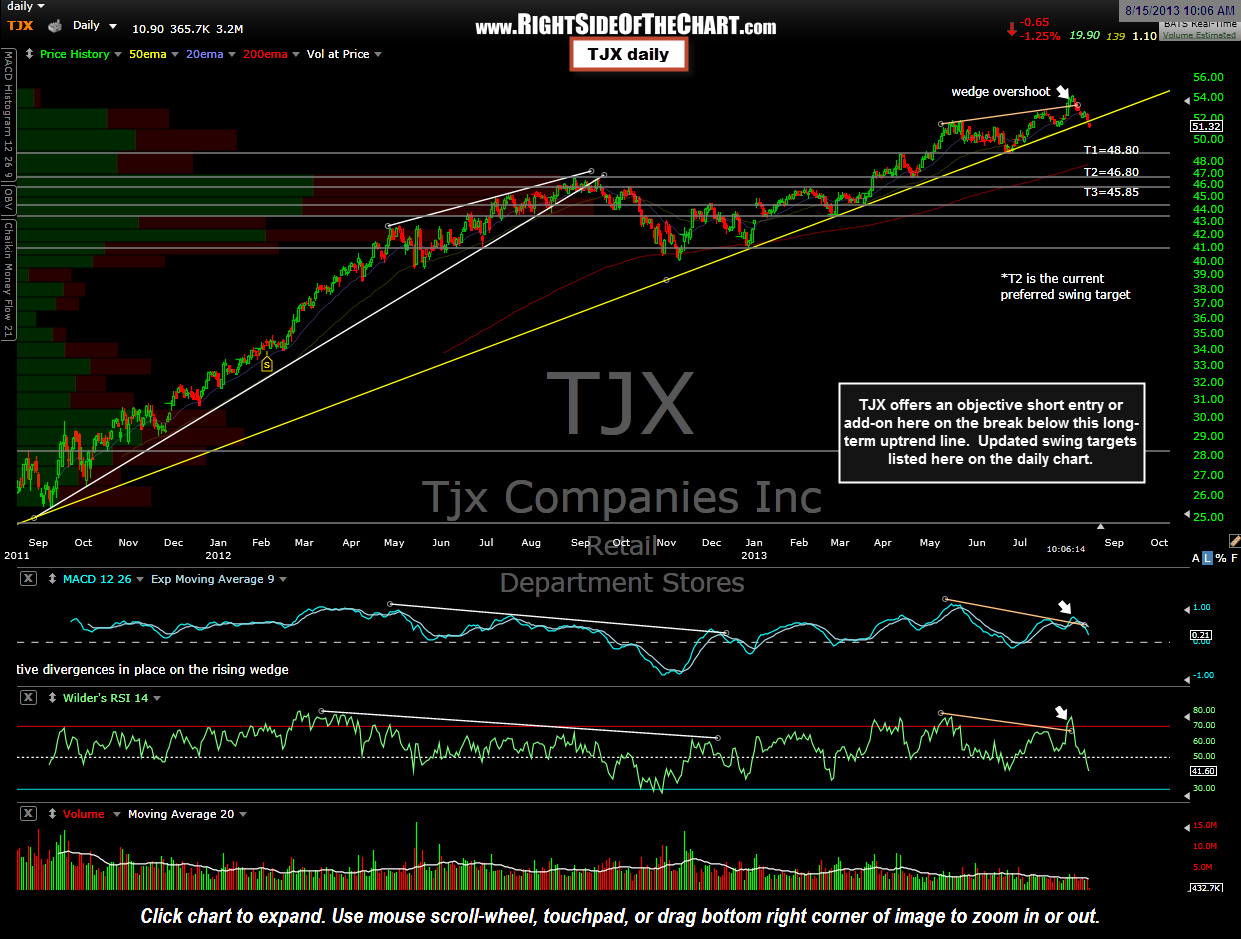
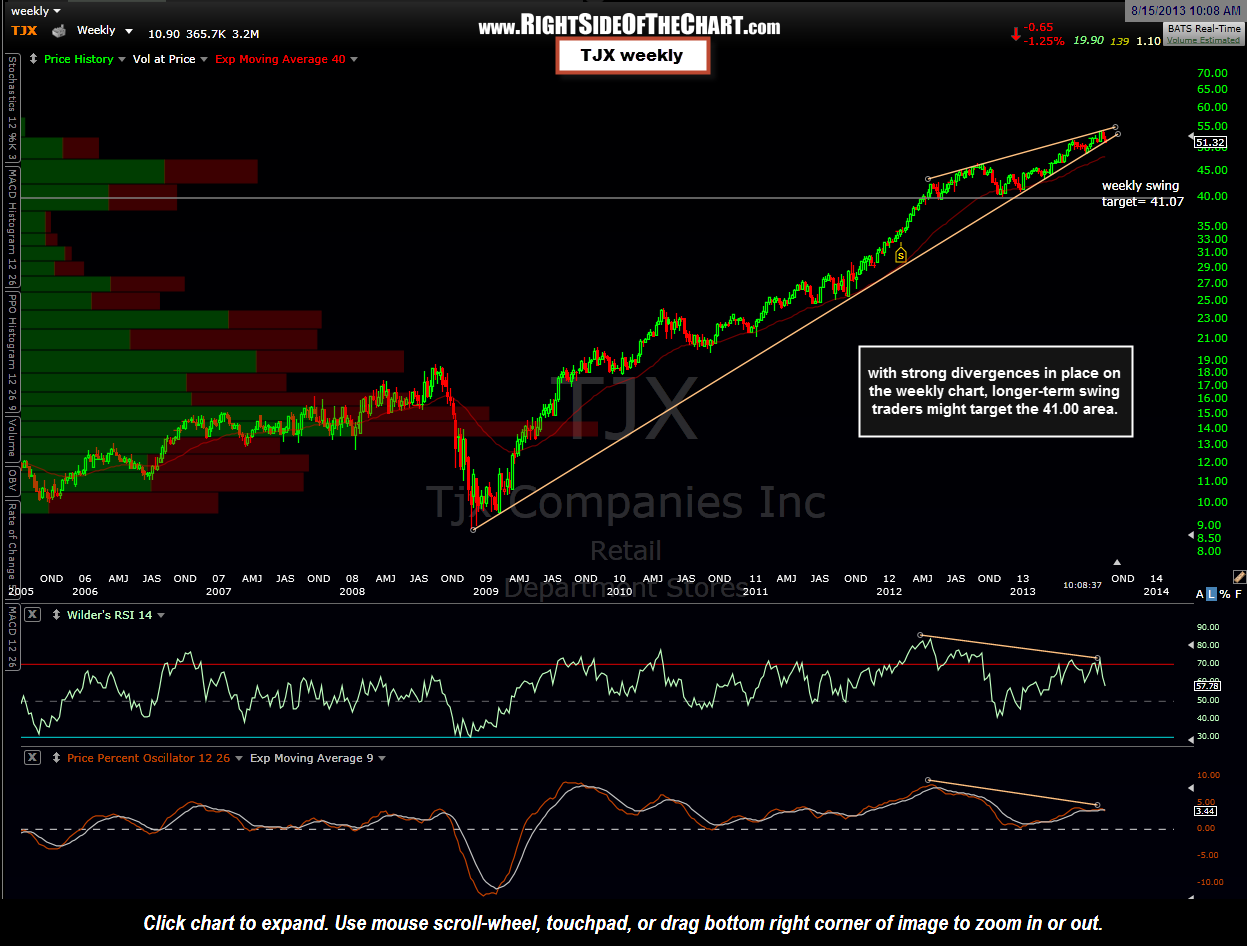
TJX has been listed as an Active Short Trade for a while now as the stock made a very brief, intraday break of the long-term daily uptrend line before closing back above that same day. We once again have a breakdown on TJX although with a much higher probability of sticking & playing out for a nice swing short trade this time around. Note the recent overshoot of the bearish rising wedge pattern on the daily chart, a technical event often followed by a fast & powerful move in the opposite direction. TJX has also recently put in some very strong negative divergences on the daily & weekly charts, further increasing the odds of a substantial correction in the stock. The targets listed on the daily chart are the typical swing trade targets while longer-term trader who believe that TJX may have seen it’s best days for a while might target the 41.00 area (suggested weekly swing target 41.07). However, at this time, my preferred target is T2 on the daily chart at 46.80. Daily & weekly charts below:

Results for {phrase} ({results_count} of {results_count_total})
Displaying {results_count} results of {results_count_total}