
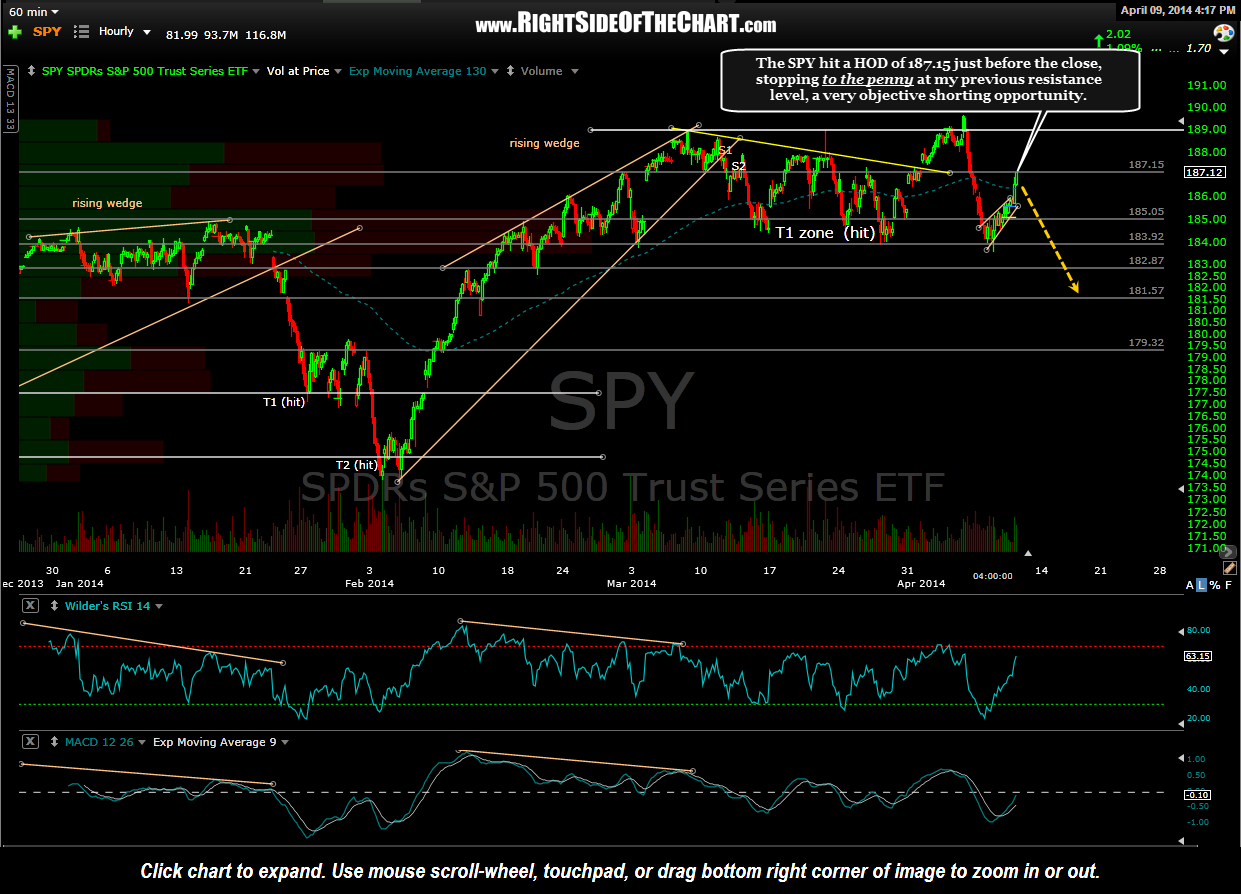
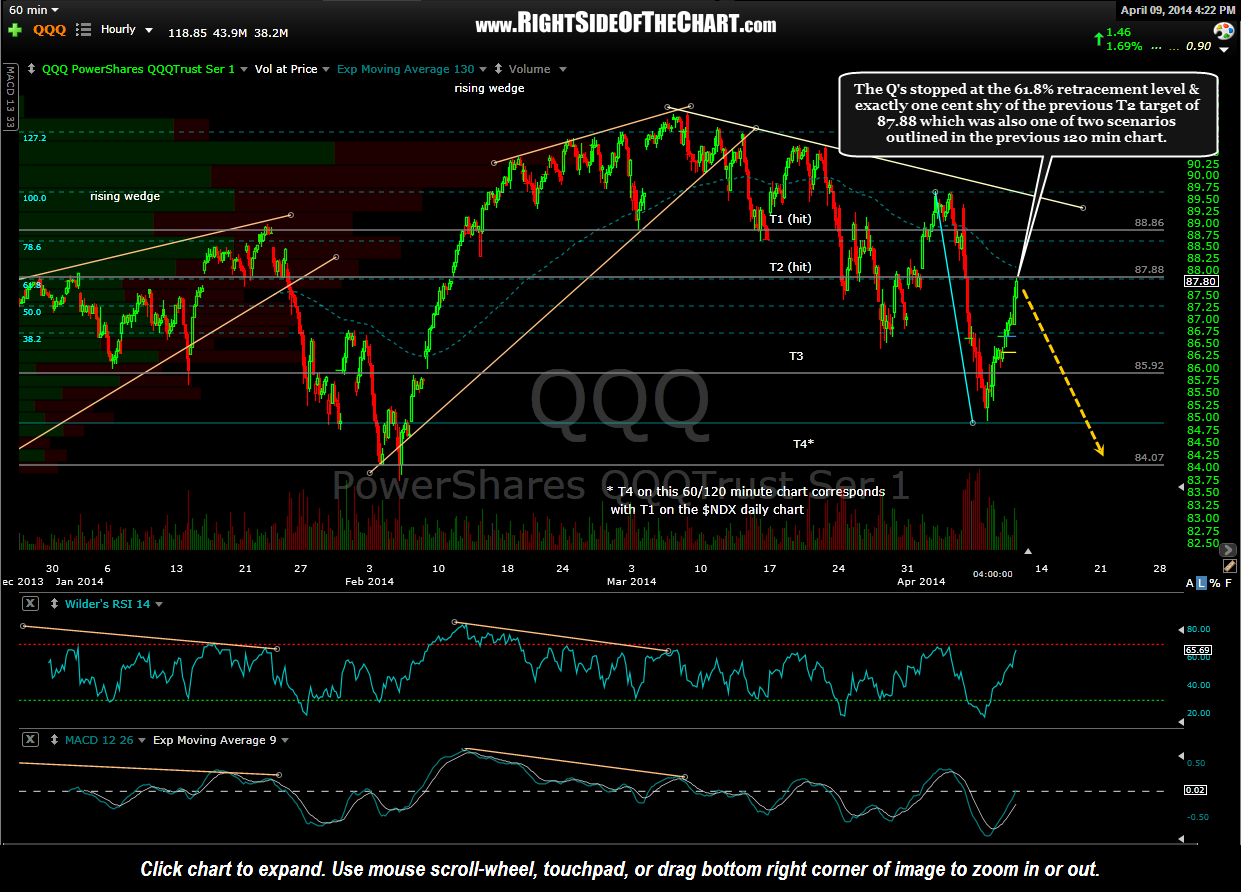
Today’s late day rally, which was sparked by the release of the FOMC minutes at 2pm ET, not only stopped cold literally one cent shy of my former downside target (T2) from my QQQ 60/120 minute time frame (remember: support, once broken, becomes resistance) but it also stopped to the exact penny at the previous posted former support, now resistance level at 187.15 on the SPY 60/120 minute charts. Although the potential bear flag highlighted on the 60 min SPY chart posted this morning did not pan out (nor did it come close to triggering a sell signal & hence, the pattern was not validated), the more bullish of the two scenarios from this morning’s QQQ 120 minute chart is playing out so far with prices peaking exactly at the top of that scenario (the former T2 level at 87.88).
Below are the previously posted 60 & 120 minute charts for the SPY & QQQ along with the updated end of day charts. As stated earlier today, there’s still plenty of upside left before the current downtrend is called into jeopardy and with the markets closing right at resistance, we’ll just have to wait until tomorrow to see if these scenarios continue to play out with the markets moving lower tomorrow (even allowing for a possible gap & crap at the open which would briefly overshoot these resistance levels).
-

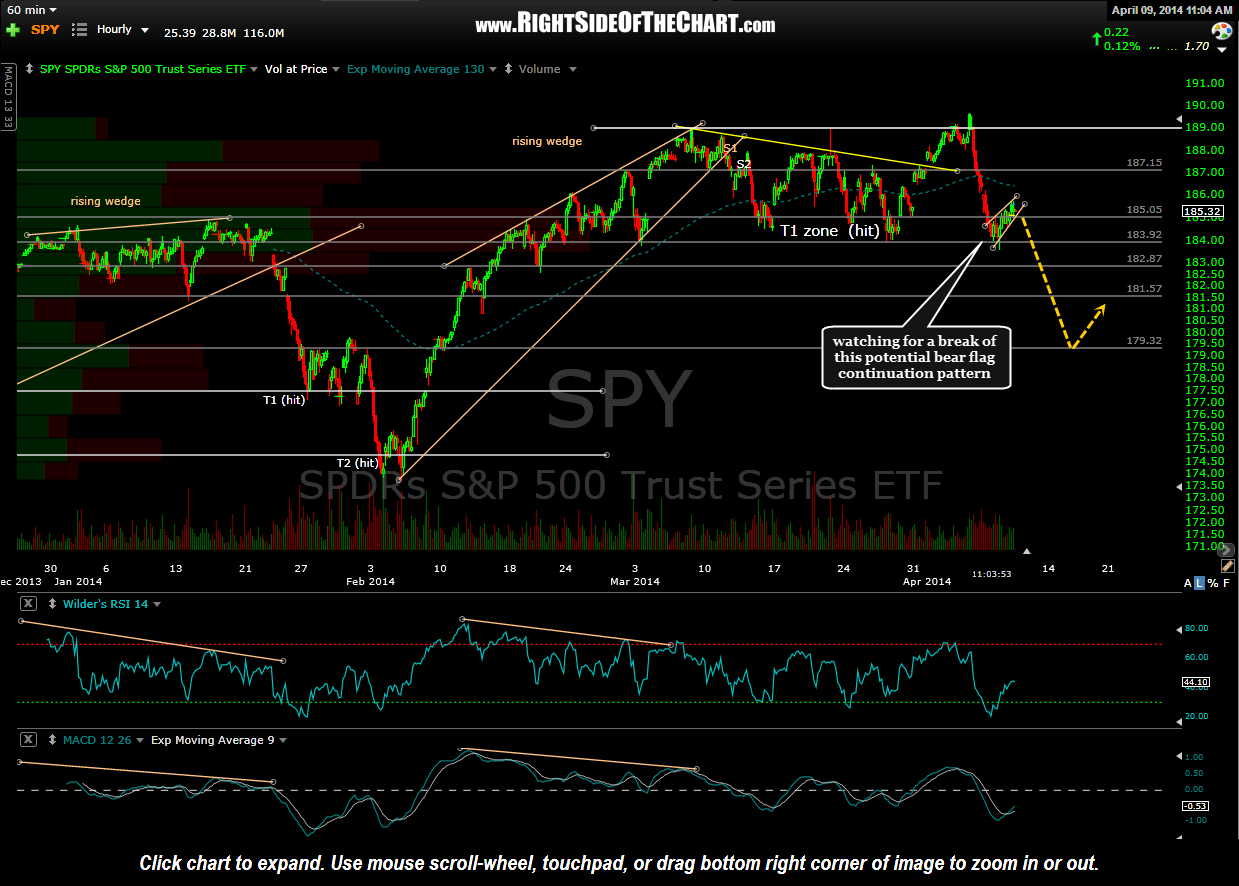
- SPY 60 minute April 9th
-
- SPY 60 minute 2 April 9th
-
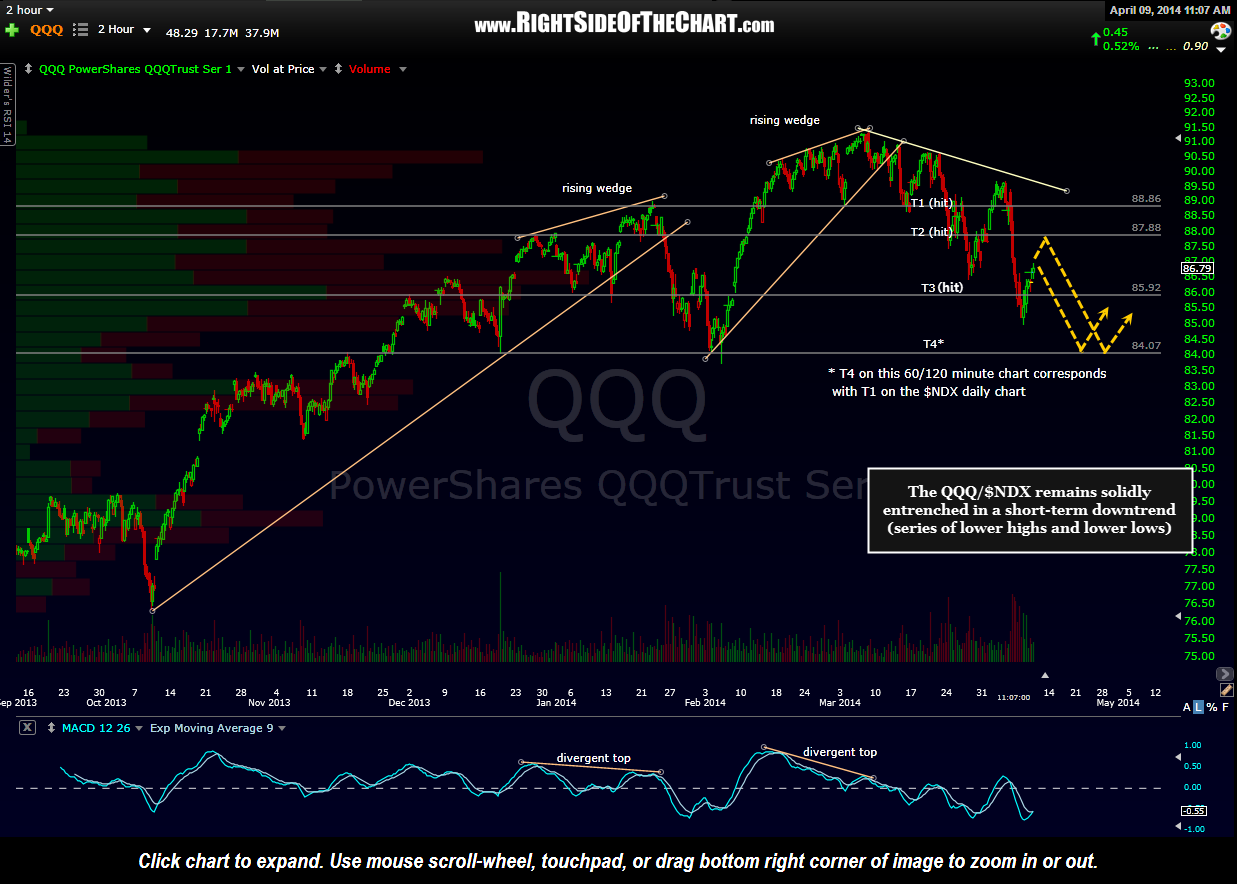
- QQQ 120 minute April 9th
-
- QQQ 60 minute April 9th
Whether or not this was the end of a counter-trend rally or not, as only time will tell, one thing that I feel strong about is the fact today’s bounce back to these resistance levels, which also lined up perfectly with the 61.8% Fib retracement of the prior move down in the QQQ, was about as objective an area to add short exposure as it gets (assuming that one’s bias is bearish, of course). For those who are bullish, my suggestion would be to wait for at least a solid move (and 60 minute candlestick close) above these level before adding much more long exposure. Although I added a fair amount of short exposure into the close today, going forward my preference will be to only add more short exposure on market weakness, not strength.