
When analyzing the charts in order to determine when a particular stock, sector, industry or even if the broad markets have broken down, I try to incorporate as many related charts as possible in order to confirm or refute my analysis.
For example, if trading one or more of the broad market tracking etf’s, let’s say the QQQ for example, and looking to position long on a breakout, I will typically hold off entering the position until not just the QQQ breaks above the resistance level or pattern that I am watching but also most or all of the other major US indices (or tracking etfs) such as the SPY, MDY, DIA. etc… The reason being that it is not uncommon to see one index breakout only to see the other key indices rejected off their subsequent attempts to breakout. Doing so will almost certainly cause the QQQ breakout to fail and as is often the case, failed breakouts are often followed by a swift and powerful reversal in the opposite direction.
That brings me to the technology sector. In returning from vacation with the fewest number of trade ideas on the site since the official launch of RSOTC in January 2012, I am actively looking for new swing trade & investment candidates. In doing so, I often use a top-down approach, starting with the broad market (is the future outlook, regardless of the current trend, bullish, bearish or neutral/unclear?). From there, I will drill down through the charts of various industries, sectors, and commodities to find any that standout as either clearly bullish or bearish. Finally, I take the most bullish & bearish sectors, etc… and drill down to find the most bullish (or bearish) individual stocks or ETFs within that sector, industry, etc…
While I’m still in the early stages of catching up on the charts, so far I have noticed that both the financials and now the technology sector are both starting to show some promise as swing short candidates. I’ve already pointed out the recent breakdown in XLF (Financial Sector ETF), along with one of the top components (BRK.b) as an Active Short Trade and I plan to add some more individual financial stocks and/or FAS (3x long financial etf) as an official short trade idea (it was already mentioned as an unofficial trade idea back on May 18th).
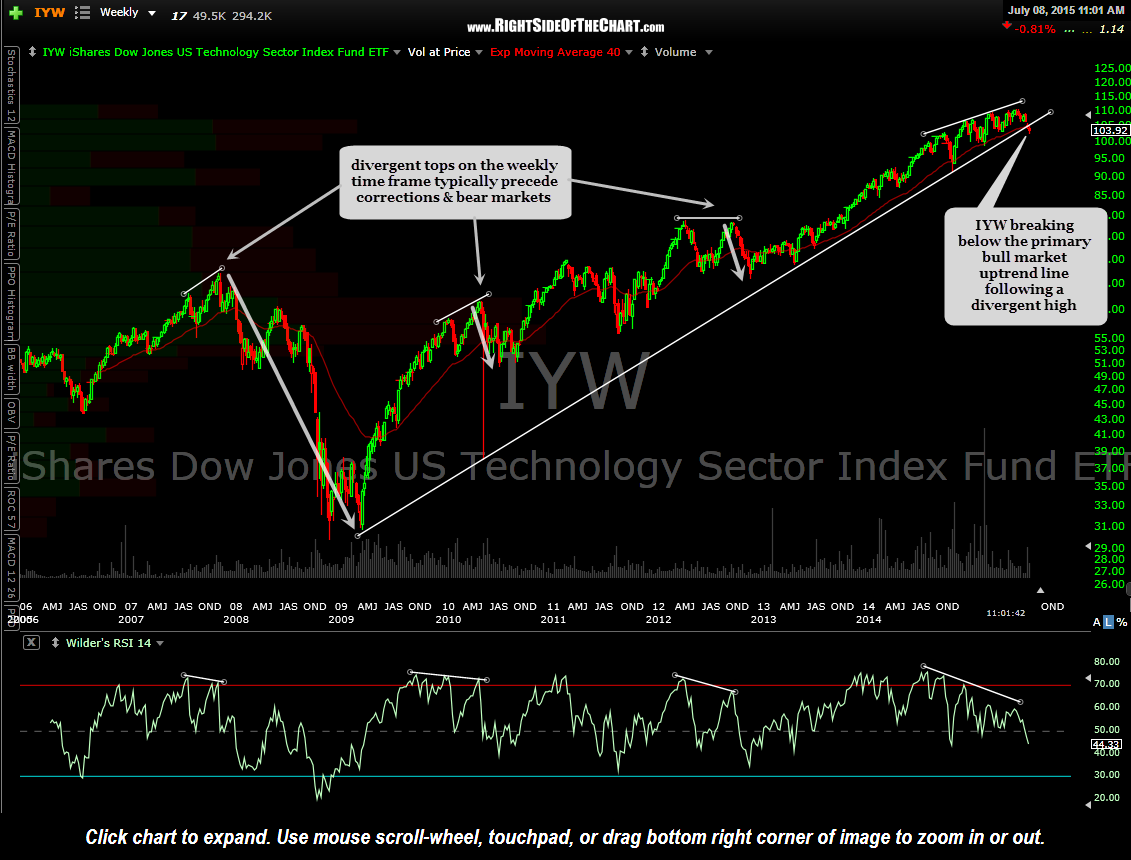
While I still have numerous industry & sector charts to comb thru, I wanted to point out some potentially bearish developments that I’ve noticed in the technology sector. As per my comments above, I’d like to see ALL of these tech ETFs breakdown below the lowest support lines on these charts. XLK is probably the most popular tech etf but as mentioned above, it is best to wait for solid confirmation of a breakdown in the tech sector before getting aggressively short, especially in this resilient, central-bank induced bull market that we’re in where false breakdowns & sell signals are more common than ever.
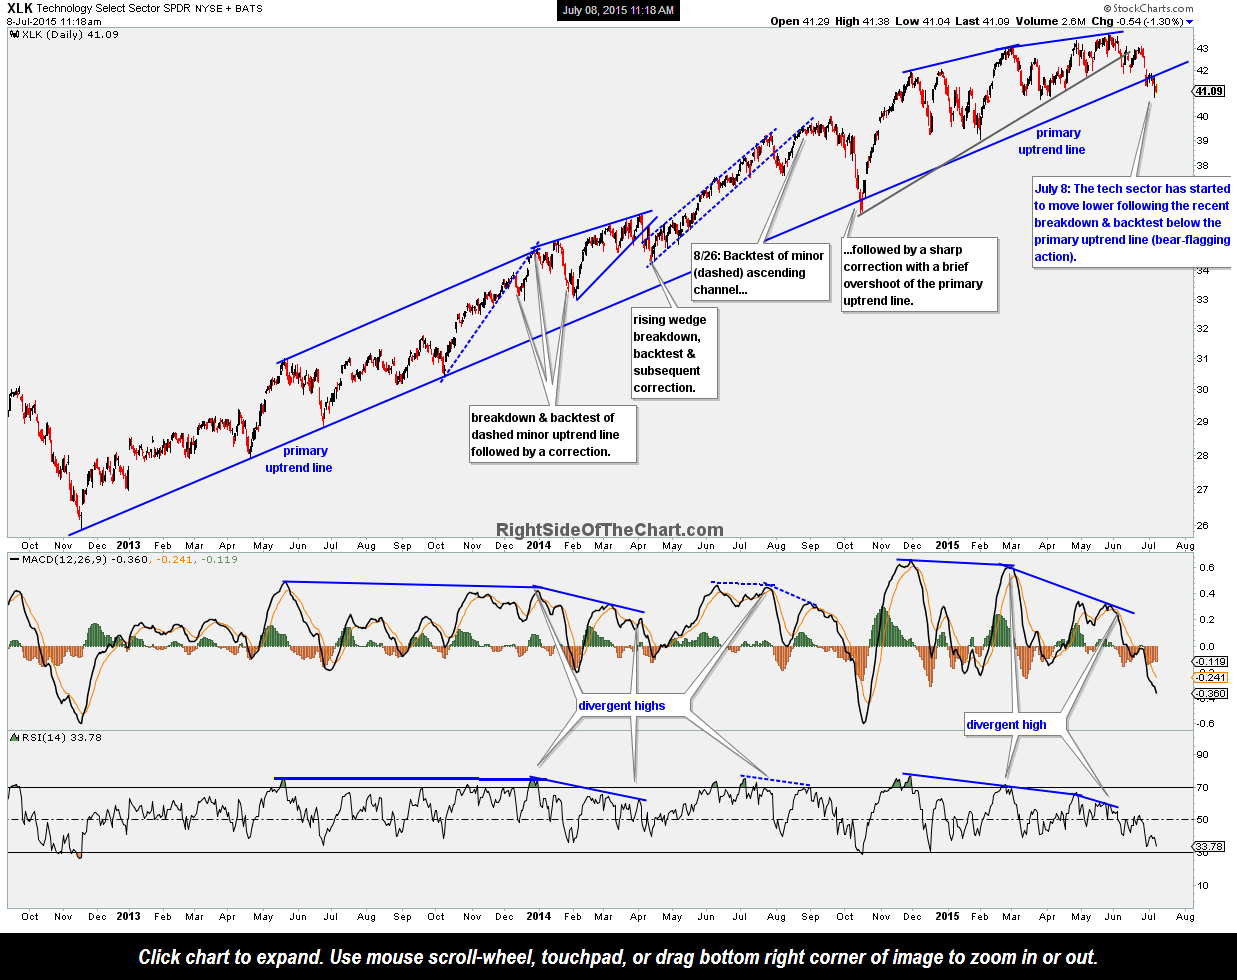
With that being said, here are a few technology ETF’s. You’ll notice on XLK that I have two slight variations of the uptrend line generated off the Nov 2012 lows. On the 10-year (black) weekly chart, I refer to that uptrend line as the “alternative/minor uptrend line” as that bigger picture also includes the entire bull market primary uptrend line that is generated off the March 2009 lows.
When zooming in on my daily chart (light gray), I labeled that a the primary uptrend line. I also used a slight variation on that daily uptrend line in which I excluded the Oct 15th & 16th reaction lows which came at the tail-end of a strong sell-off in the tech sector. As is often the case, very strong momentum during a rally or sell-off often results in a very brief overshoot of resistance or support. The result is that the weekly chart shows XLK currently trading at trendline support while the daily chart shows a recent breakdown & successful backtest of that trendline (with the backtest taking the form of a bear flag continuation pattern).
-

- XLK daily July 8th
-
- XLK weekly July 8th

-
- IXN weekly July 8th

-
- IYW weekly July 8th
I plan to drill down into the individual components of the tech sector to find the most promising candidates but I with some of these tech ETFs sitting right on uptrend line support, my preference is to see all of those support lines taken out, especially on a weekly closing basis before aggressively shorting the tech sector. On the flip-side, for those who are bullish, support is support until broken and this could prove to be a buying opp if these levels hold & tech stocks rally from here. Once I drill down into the charts of the individual tech stocks, I might have a better feel of whether I should be viewing these tags of trendline support as a buying opp or a chance to short the tech stocks should all those trendlines give way soon.