
In response to the erratic, back & forth price action in the markets & most sectors over the last two months, I posted the following reply to a comment on how difficult it has been to make money lately with so many nice chart patterns that just don’t seem to be playing out, including the XOP/GUSH short that triggered an entry back on April 29th, went on to quickly hit the first profit target for a 10%/30% gain, but then reversed shy of the 2nd & final target, trading sideways since then. My reply was:
I have some thoughts on that which I’ll share along with some charts here or on the front page as you bring up a good point that I believe warrants some discussion. Essentially, it comes down to patience. The market has been just as frustrating for me lately with so many nice short setups that started to play out nicely a couple of months ago but nearly all were hit with sudden rallies that ripped prices right back to where those patterns broke down or in most cases, just slightly above… very frustrating & hard to see coming in the charts IMO.
While one could certainly claim that the early May – early June rallies were a sign of the market’s strength & refusal to go down, not only did that rally put in consecutive, more power divergent highs but I sometimes it feels like most seem to miss the point that the US stock market topped about a year ago & despite the fact that just one of the major diversified indexes ($SPX) isn’t too far from that May 2015 peak, every other major diversified index: $COMPQ, $NDX, $RUT, $MID & even the $WLSH is still comfortably below their bull market highs, with the $RUT & $MID already well exceeding the 20% drop that defined a bear market & the $COMPQ coming within mere basis points of a 20% drop.
Back to my point, I’ll post a couple of charts that highlight how when swing trading, especially during a 2-year sideways/topping market, one must patiently wait for the few big swing-tradable uptrends & downtrends and that getting caught up in a sideways range, such as XOP has been in for the last two month, is just a part of the game. As much as I would have preferred to have avoided that sideways grind & held off on my GUSH short, I’m fine with sitting tight until the trade either hits my final & preferred target (T2) –OR– I’m stopped out –OR– something changes in the charts that convinces me that the R/R no longer warrants remaining short.
This first chart below is a 10-year weekly chart of the SPY highlighting the fact that the last 2 years has been marked by a large sideways trading range which appears to be a gradually topping process in the stock market.

SPY 10-year weekly June 21
When viewed on a longer-term chart, the 2-year period on this daily chart is simply a sideways-to-slightly lower trading range. While buy & hold investors have gone nowhere, there have been several lucrative swing trading opps on both the long side (green) and short side (red), all of which came suddenly following periods of choppy, unpredictable trading ranges (yellow), such as the last two months. My expectation is that it next lucrative swing trade opp is coming soon & will likely be to the downside. Should the charts convince me otherwise, I will do my best to recognize & communicate my change in market bias asap.
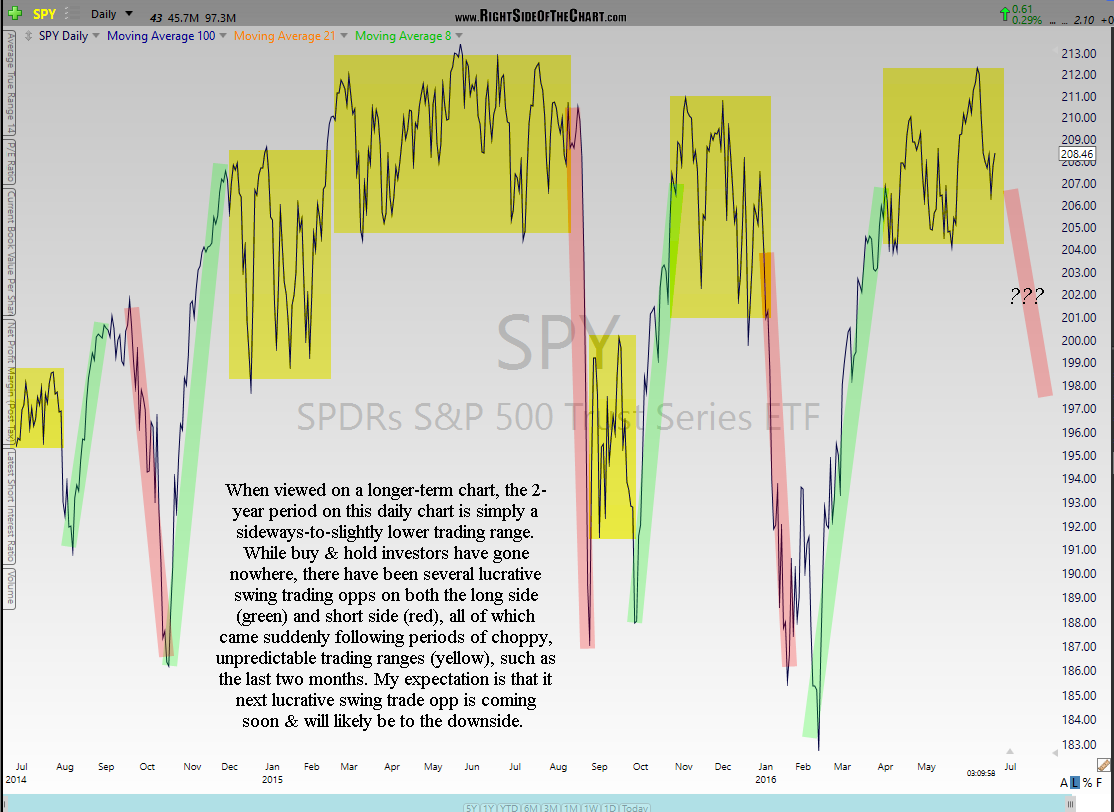
SPY 2-year daily June 21st