
So far today, despite a decent rally in the major US stock indices, the near-term trends on most major US stock indices remain bearish. My favor trend indicators for defining the near-term trend are the MACD signal line (9-ema) and the 13/33-ema histogram, the latter providing a quick visual representation of when the 13-ema is trading above (green) or below (red) the 33-ema.
-

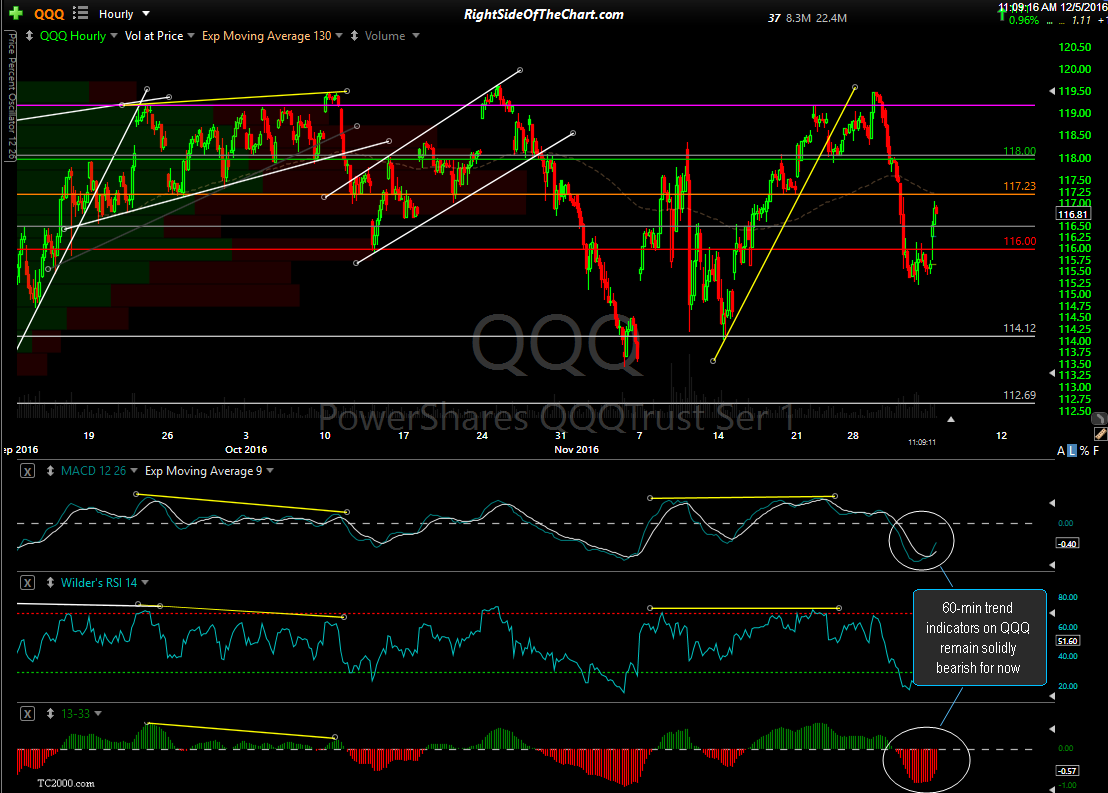
- QQQ 60-minute Dec 5th
-

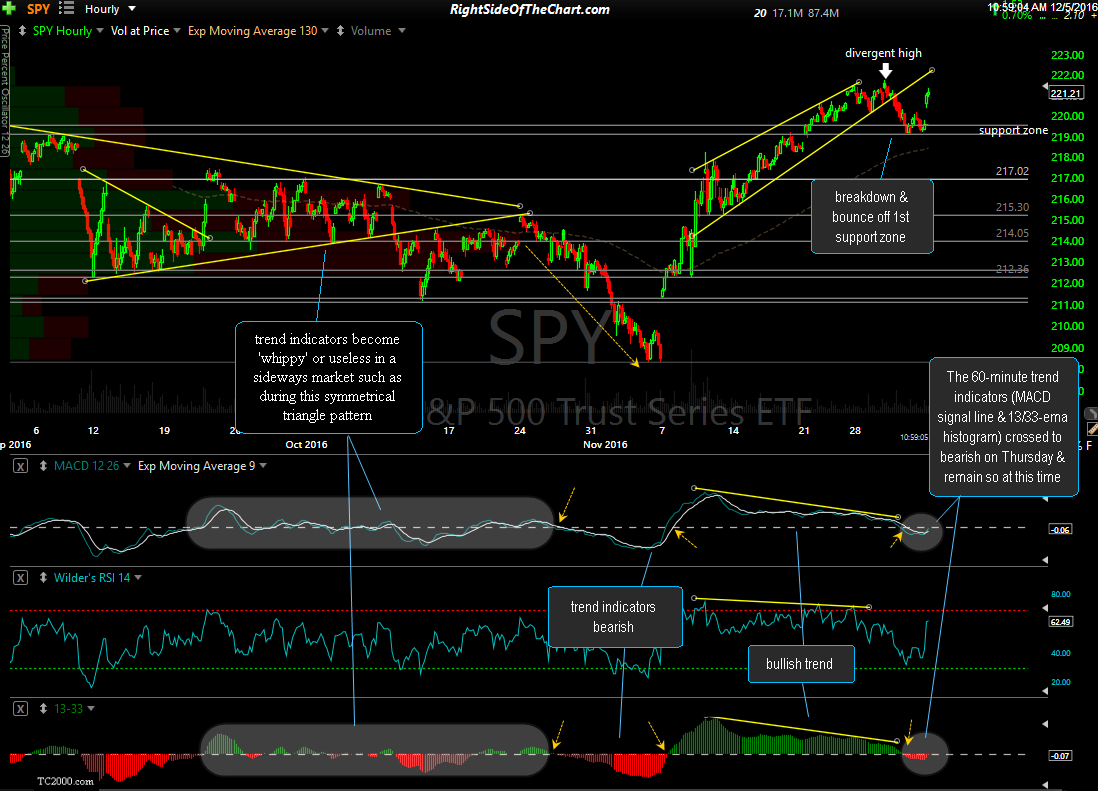
- SPY 60-minute Dec 5th
-

- IWM 60-minute Dec 5th

I use these trend indicators on the 60-minute time frames with a cross above (bullish) or below (bearish) their respective zero lines to help identify possible trend changes as well as to help confirm that an existing trend is still intact (once the 9-ema & 13/33 histogram are both trading above or below their zero lines). As with most trend indicators, these 60-minute trend indicators are best used in conjunction with other buy or sell signals, such as a breakout above a bullish or bearish chart pattern and/or support or resistance levels.
What stands out to me on the 60-minute charts above is the fact that the QQQ has been significantly under-performing the SPY & IWM in recent weeks. While the SPY & IWM could flip back into bullish territory on their 60-minute trend indicators with any additional upside in the market in the next day or so, the 60-minute trend indicators on QQQ remain solidly bearish at this time with QQQ well off its recent highs.