
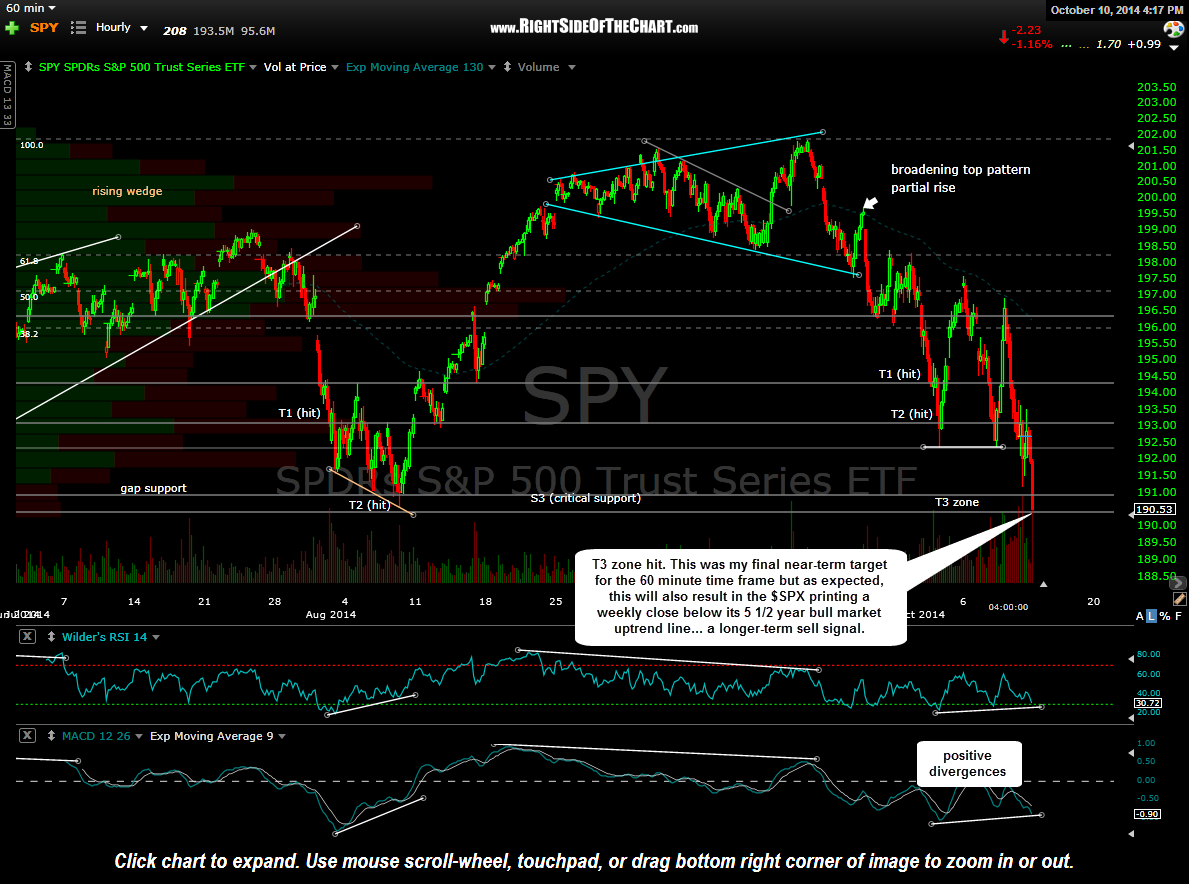
The SPY closed right on the bottom of my 3rd & final near-term target zone which was based off of the short-entry from the partial rise into the broadening wedge pattern on the 60 minute chart. In a vacuum, I would have covered all or most of my short positions as the SPY has positive divergences in place on the 60 minute chart on the initial tag of this support level (ideal ingredients for a bounce). However, as discussed recently, the bigger picture has the S&P 500 printing the first weekly close below this primary bull market uptrend line generated off of the March 2009 lows. Therefore, we have a mixed picture in the charts right now with potentially short-term bullish developments against a cross-current of longer-term bearish developments.
-

- SPY 60 min Oct 10th
-
- $SPX weekly Oct 10th
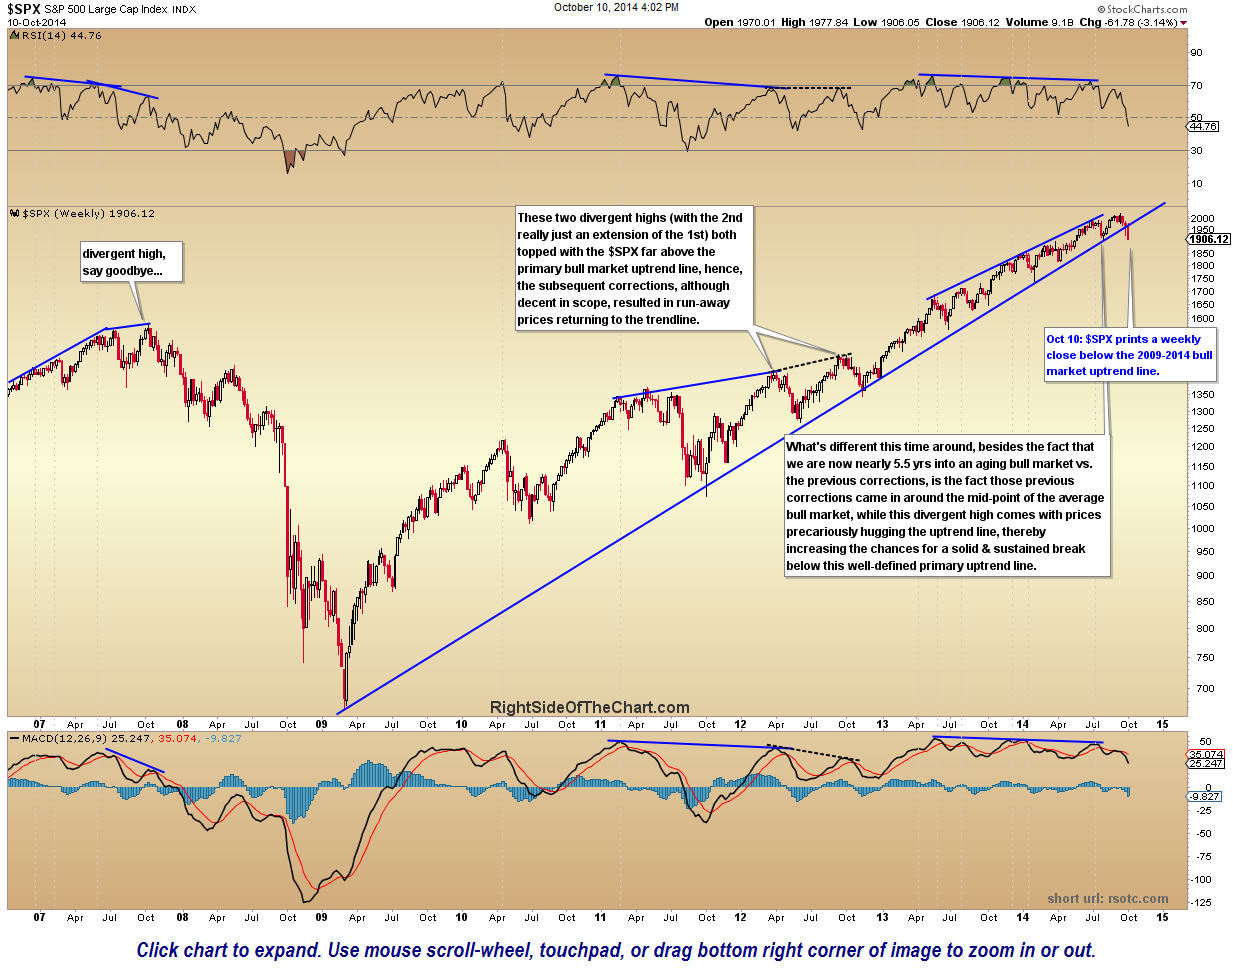
I say potentially short-term bullish developments because although prices are at support with bullish divergences in place on the 60-minute time frame, the near-term trend, by all accounts, is clearly bearish at this time with no signs of a reversal yet. With that being said, until this support (the Aug 7th reaction low) is clearly taken out and the bullish divergences are negated (i.e.- burned thru), the potential for a bounce is elevated. On the flip-side, the longer-term (weekly charts) take precedence over the shorter-term charts and today’s weekly close below the bull market uptrend line in the $SPX has the potential to open the door to a much deeper correction or more. It is also worth noting that we printed a weekly close below the Wilshire 5000 Composite Index bull market uptrend line as well as a solid close below the base on the double-top pattern on the Russell 2000 Small Cap Index. However, keep in mind that this market has been plagued with false breakdowns & whipsaw sell signals for years now so it might be prudent to wait for some downside follow-through before making any substantial positioning changes. Also keep in mind that although the 20/50-day ema intermediate-term trend indicator went bearish earlier this week, both the 43/17-week ema pair as well as the 10/6-monthly ema pair on the $SPX are still very solidly entrenched in buy signals (these two pairs do a great job of defining cyclical & secular bull & bear market trends). More on those later.
The bottom line is that we are still most likely in the early stages of a much deeper correction although we do have some conflicting signals in place at this time. If I had to venture a guess, I’d say that we are likely to see a pop (rise) in the market on Monday, maybe moving higher to backtest the weekly uptrend line from below (even moving above it intraday, possible even a couple of days), only to turn back down with some impulsive selling to kick in next week. That’s just my best guess but I wouldn’t be surprised to see the markets gap down & continue to move down sharply next week either. With the near-term picture somewhat obscure at this time, my plan is to wait to see how we trade early next week before making any considerable changes to my positioning. With the trade ideas now updated, I will turn my efforts into finding new trade ideas as well as highlight many of the existing active trades that still look compelling. Have a great weekend.