
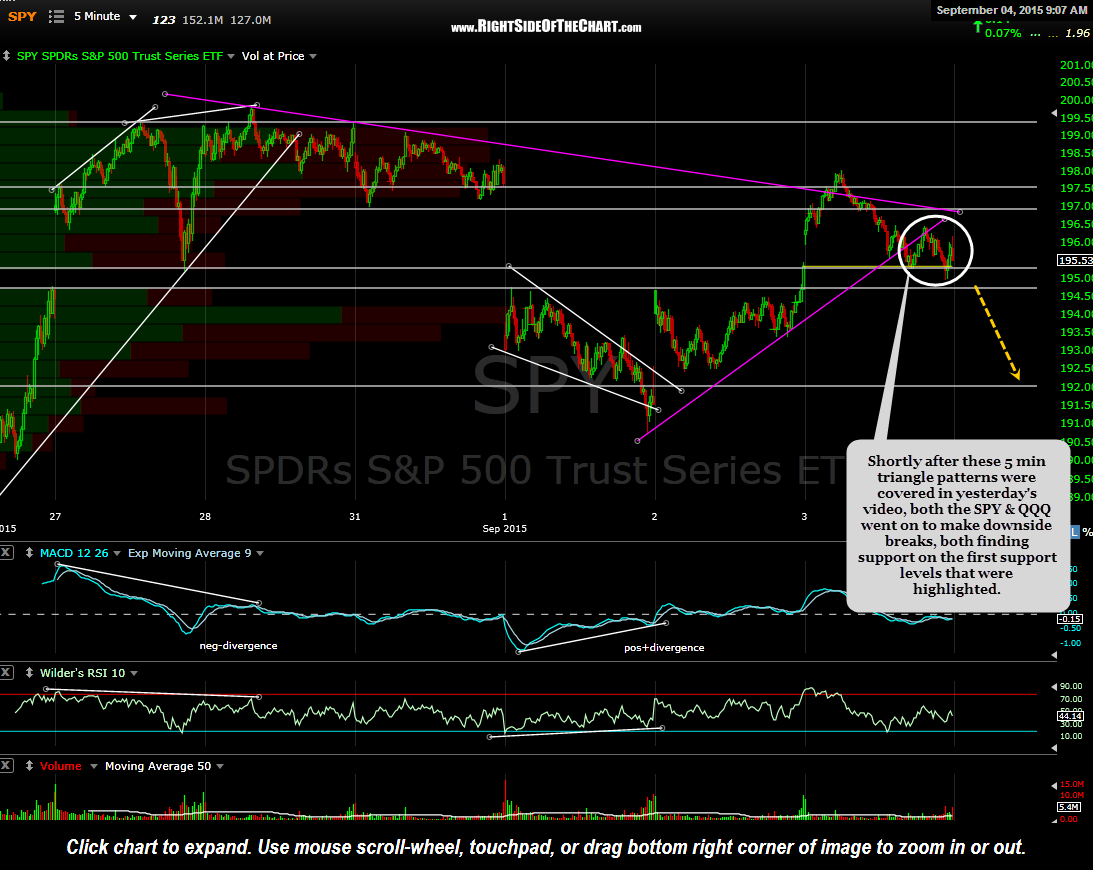
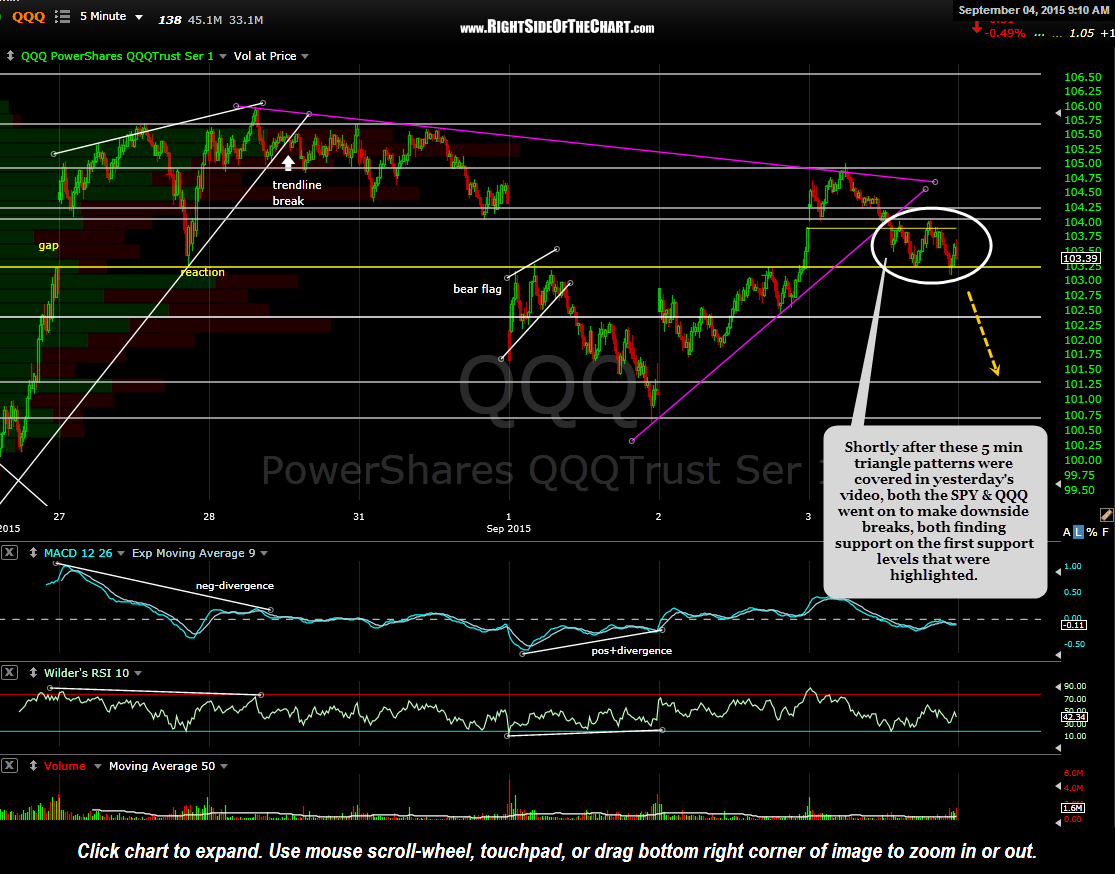
Shortly after these 5-minute triangle patterns were covered in yesterday’s video, both the SPY & QQQ went on to make downside breaks, both finding support on the first support levels that were highlighted. It was stated that the next big thrust up or down in the market, relativity speaking to the scale & scope of these charts, would most likely be determined depending on which way these patterns broke.
-

- SPY 5 minute Sept 3rd close
-

- QQQ 5 minute Sept 3rd close
The large chart below (black background) is a screenshot of the 5-min SPY chart from yesterday’s video with arrows that were drawn indicating what would likely happen once prices broke below the triangle pattern. Overlaid on the left of this chart is an updated 2-minute streaming chart of the SPY which shows that prices have continued to move lower since breaking down shortly after the video was posted yesterday & have now hit the 192 support/target in pre-market trading (shaded areas) this morning. As reactions on the first tag of a support level from above are likely (and has already taken place since the screen capture), my expectation is that the reaction off this level will be relatively short lived, with both the SPY & QQQ likely heading lower at some point in the regular session today, going on to take out the pre-market lows possibly moving down to the critical support levels which were recently highlighted on the QQQ & SPY 5-minute charts (98ish level on the QQQ & 187ish level on the SPY).
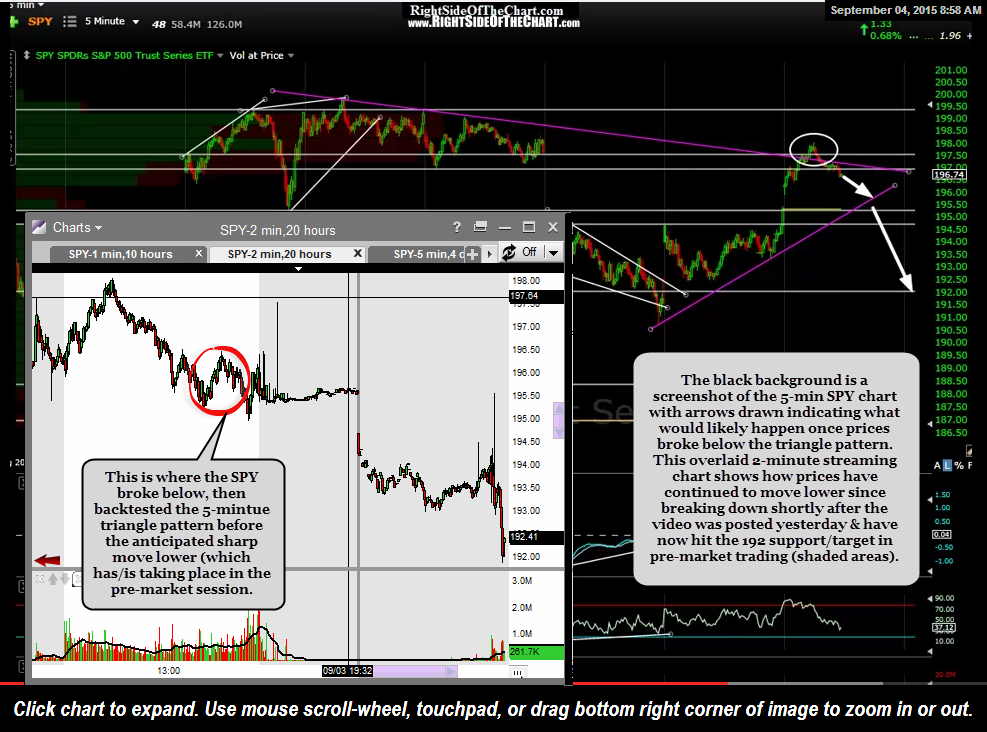
SPY 5 min- 2 min pre-market Sept 4th