
As seen on this daily chart, should the SPY somehow manage to power thru the 198ish resistance level, it will still have a massive wall of resistance around the 204 level to contend with.
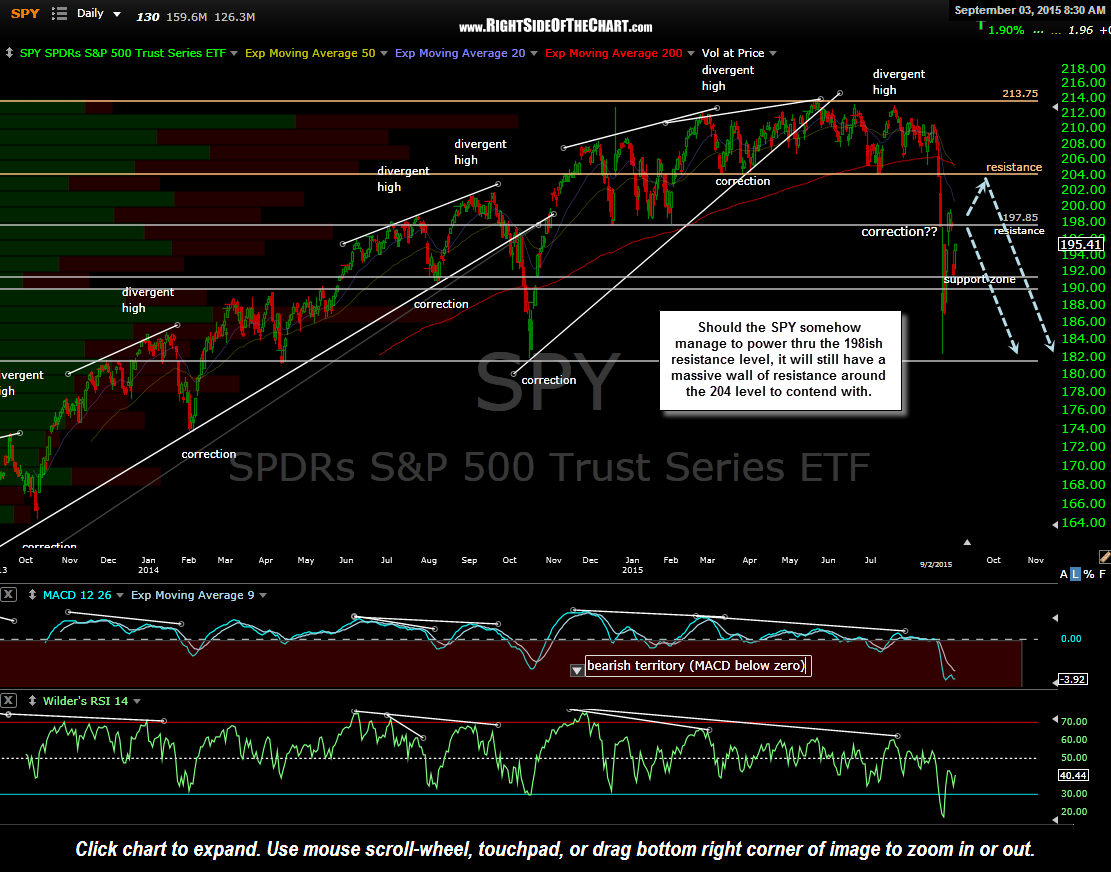
SPY daily Sept 3rd
Looking at the daily chart of QQQ we have at least 3 major resistance levels just overhead to contend with; both the 200ema & horizontal resistance around 105.90 & the recently broken uptrend line just above that. Any move at or just below that area provides a very objective short entry or add-on with stops placed somewhat above the aforementioned resistance levels.
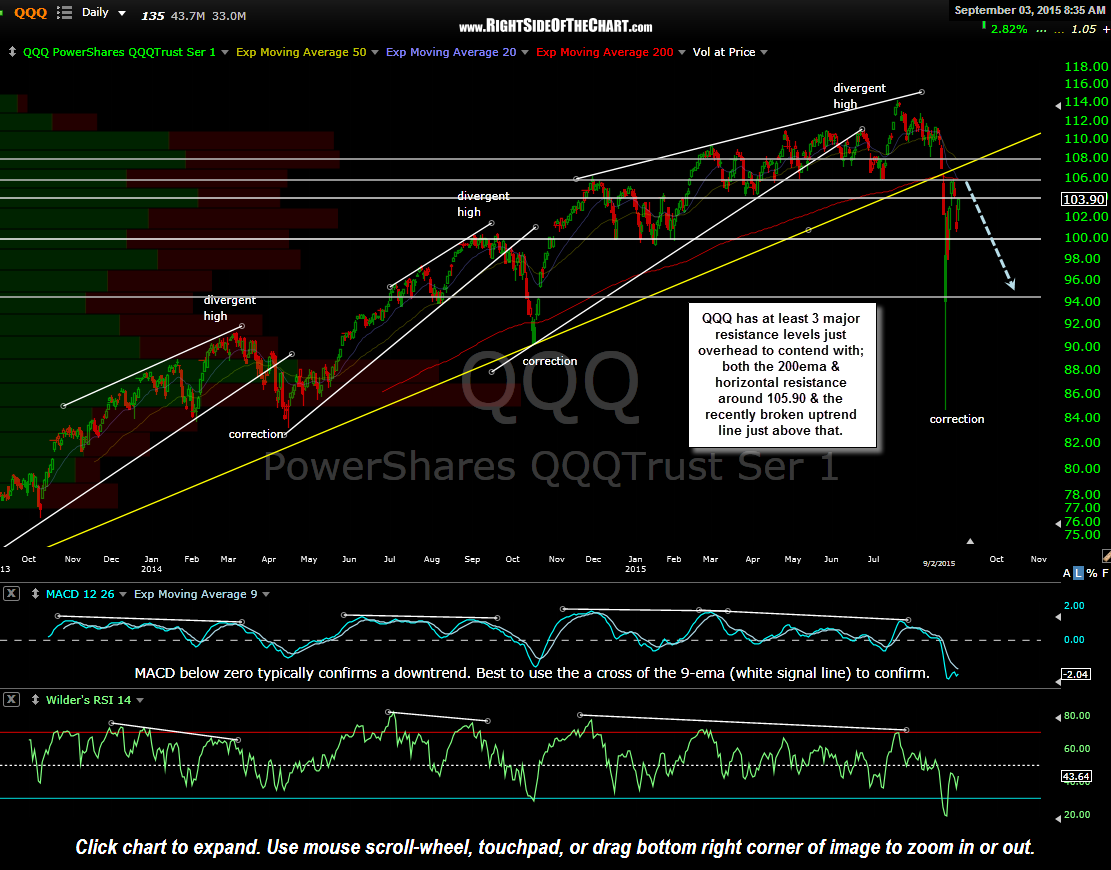
QQQ daily Sept 3rd
This SPY 60 minute chart below shows all the key overhead resistance levels, any of which are likely to cap any advances in the S&P 500 index.
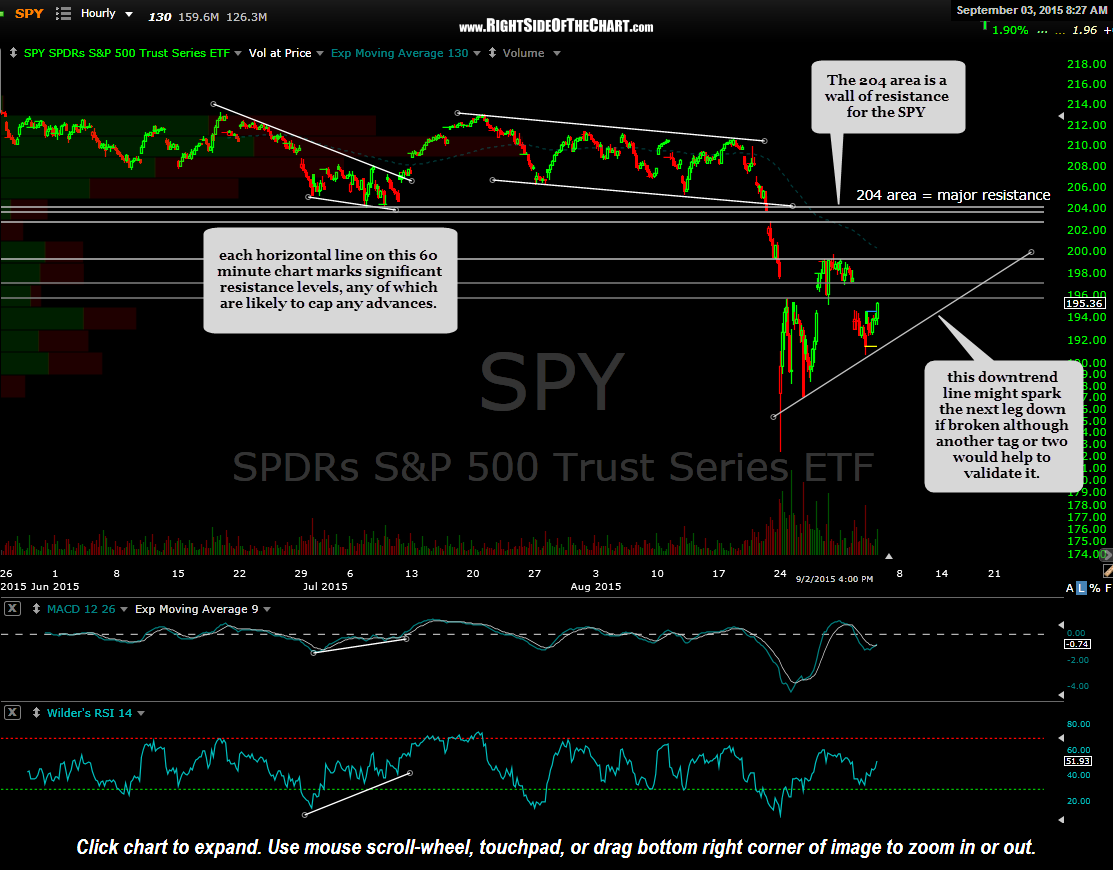
SPY 60 minute Sept 3rd
Zooming down to a 5-minute period chart, QQQ is currently poised to gap open around the 105 resistance level. My best guess scenario is shown with the blue dashed arrows. Should they build on any opening gains, the 105.70 area is the next likely reversal point.
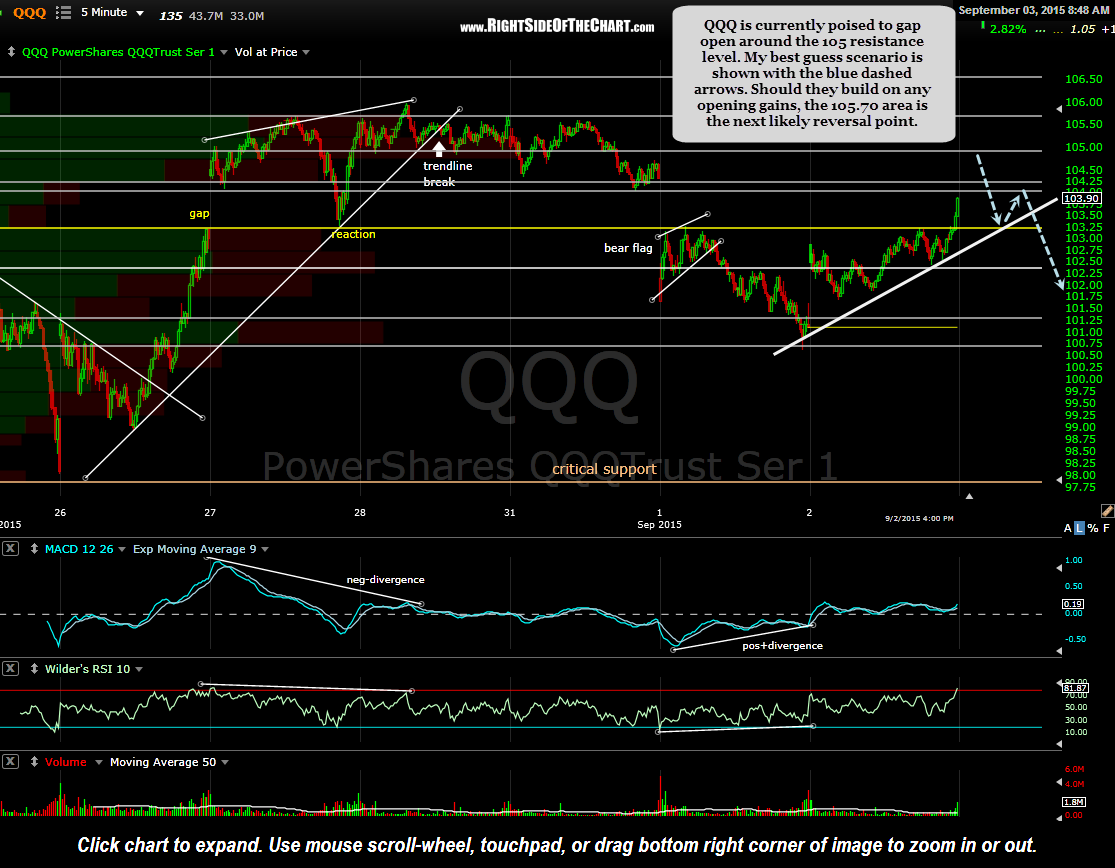
QQQ 5 minute Sept 3rd
Looking the 5 minute chart, the SPY is likely to reverse at the 197 area (primary scenario- blue) with the possibility of a continued move toward the 199.40 area before reversing (alternative- yellow).
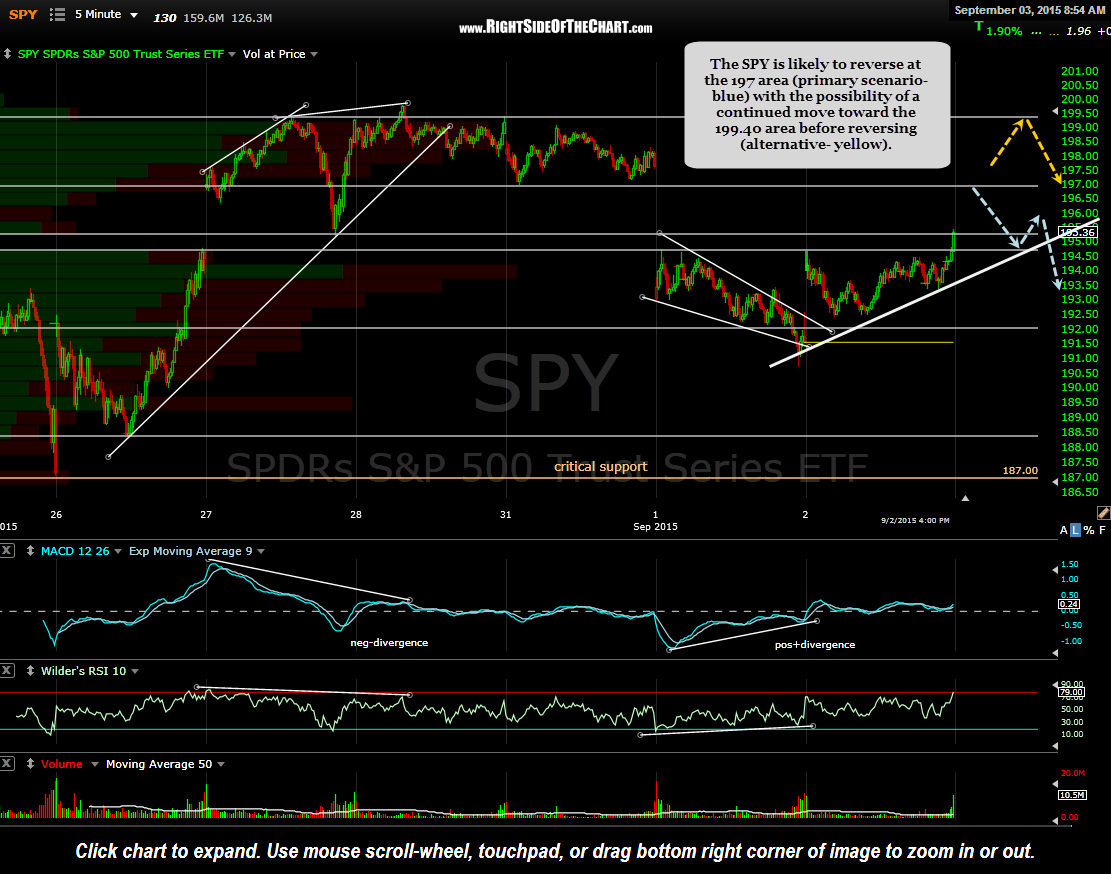
SPY 5 minute Sept 3rd
Bottom line: The near-term direction of the market is not very clear at this time although there are numerous well-defined short-term support & resistance levels that may provide day trading opps while swing traders can begin initiating or adding short exposure anywhere from today’s likely gap higher up until the major resistance areas shown on the daily charts above (with stops set somewhat above the top of those resistance zones).