
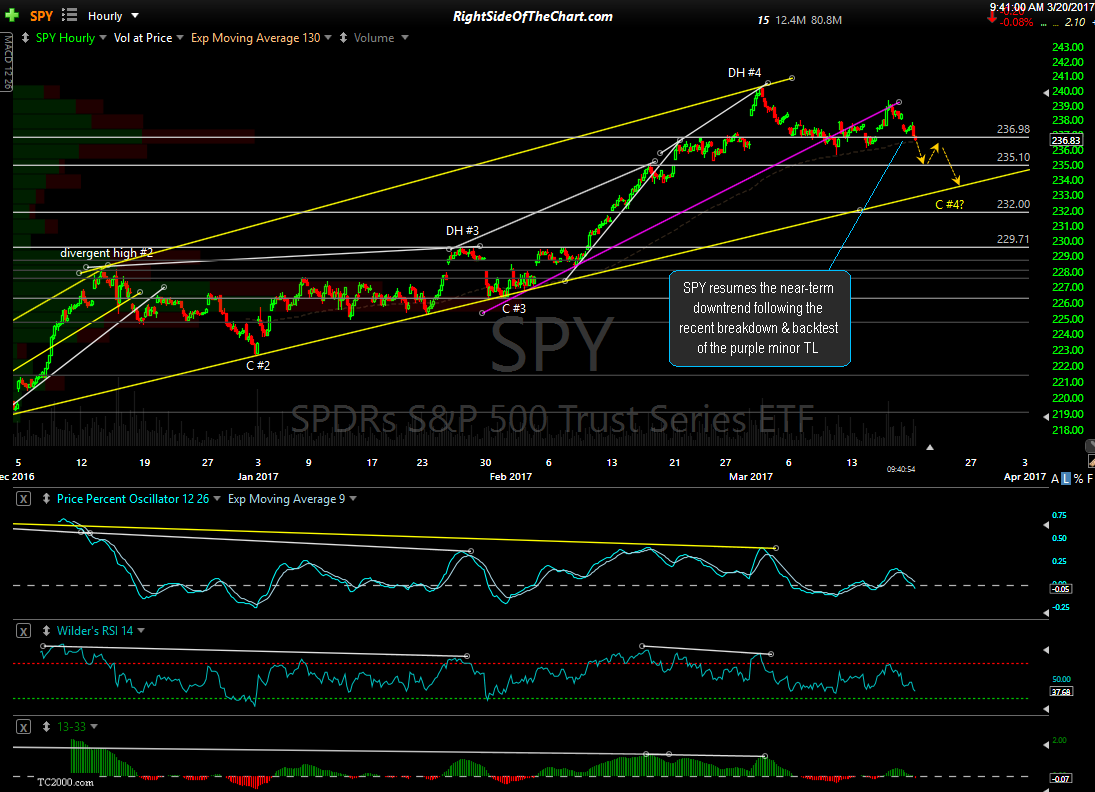
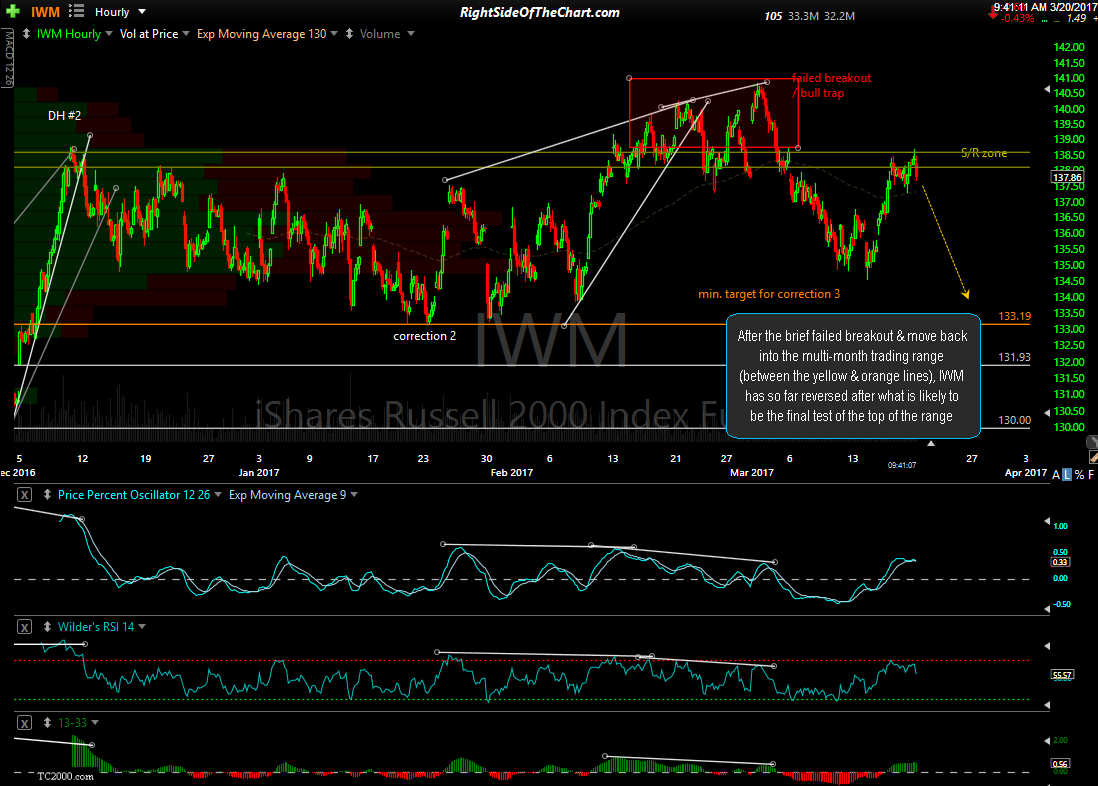
A quick overview of the US stock market via the 60-minute charts of SPY, QQQ & IWM: SPY resumes the near-term downtrend following the recent breakdown & backtest of the purple minor TL, QQQ seems to be in a state of suspended animation over the last month, going virtually nowhere despite clearly bearish technicals that indicate a pullback is coming while IWM has so far reversed after what is likely to be the final test of the top of the range following the brief failed breakout & move back into the multi-month trading range (between the yellow & orange lines).
-

- SPY 60-min March 20th
-

- QQQ 60-min March 20th

-

- IWM 60-min March 20th
On an administrative note, there was recently an issue where the menu would not open while viewing RSOTC.com on mobile devices. That issue has now been resolved. That issue, along with the appearance of the ticker symbols located at the top of each trade category page was due to some recent software updates to the website, the latter of which should be resolved this week. If you experience any issues with the site, please report them via the contact form.