
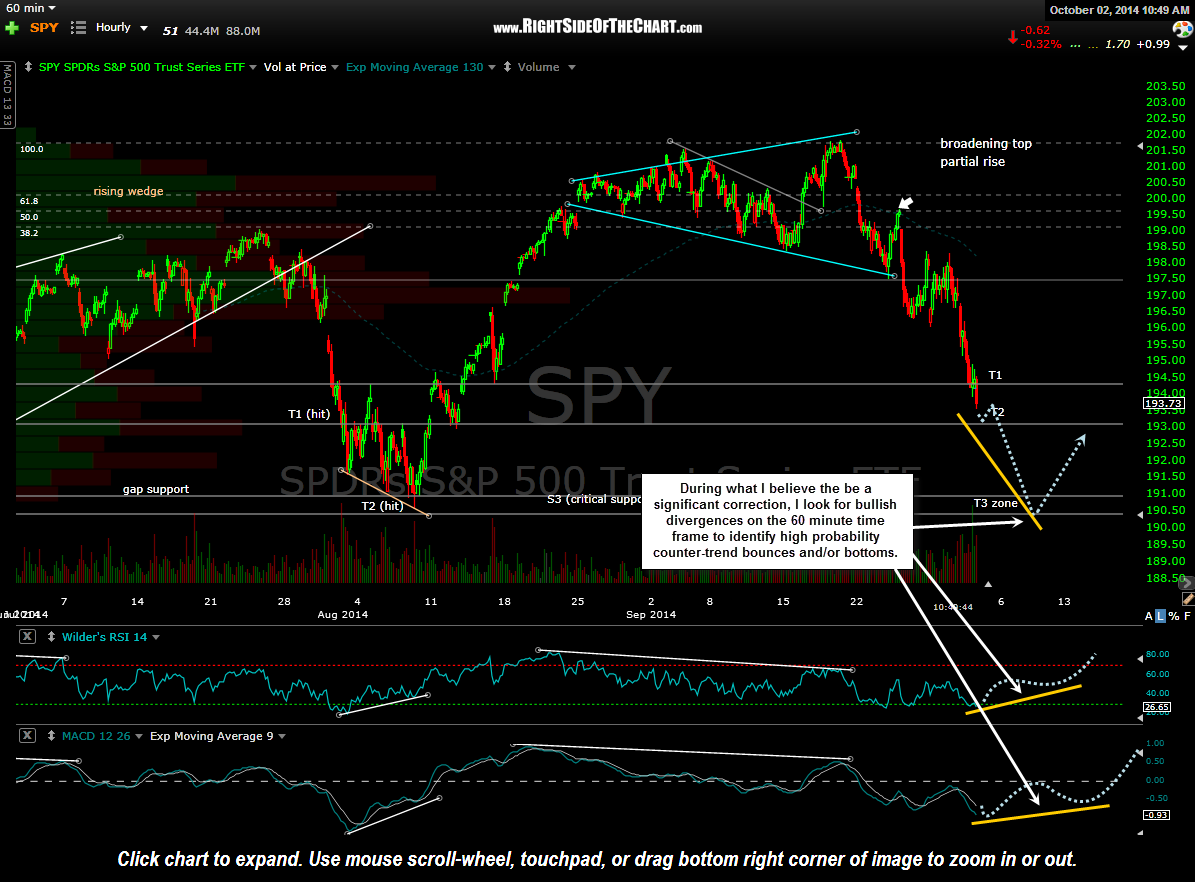
The SPY is approaching the second near-term downside target (T2) on the recently posted 120-minute chart. This updated 60-minute SPY chart shows how these short & intermediate-term targets can be used by active traders as the initial tag of each target level is often followed by a bounce and/or consolidation (allowing to opportunity to book partial or full profits, possibly even take a quick counter-trend bounce trade). The levels can also be used by typical swing traders to manage entries & exits on existing positions and trade setups. E.g.- One could use a break of support to reduce long exposure and/or add short exposure. I also try to avoid entering new short positions, even if a short entry is triggered on a breakdown, if the broad markets are approaching a support level in which I expect a meaningful bounce.
Yesterday we saw the SPY bounce off the initial tag of the T1 level and prices hovered around T1 until finally making a clear break of that support level today (hence, sparking the next impulsive downside move towards the T2 level, where the SPY will once again likely find temporary support). Once/if the T2 support level is clearly taken out, I would expect another relatively swift move down to the T3 zone at which time I will be watching to see if the SPY has started to form bullish divergences on the 60 minute time frame.
-

- SPY 60 minute Oct 2
-
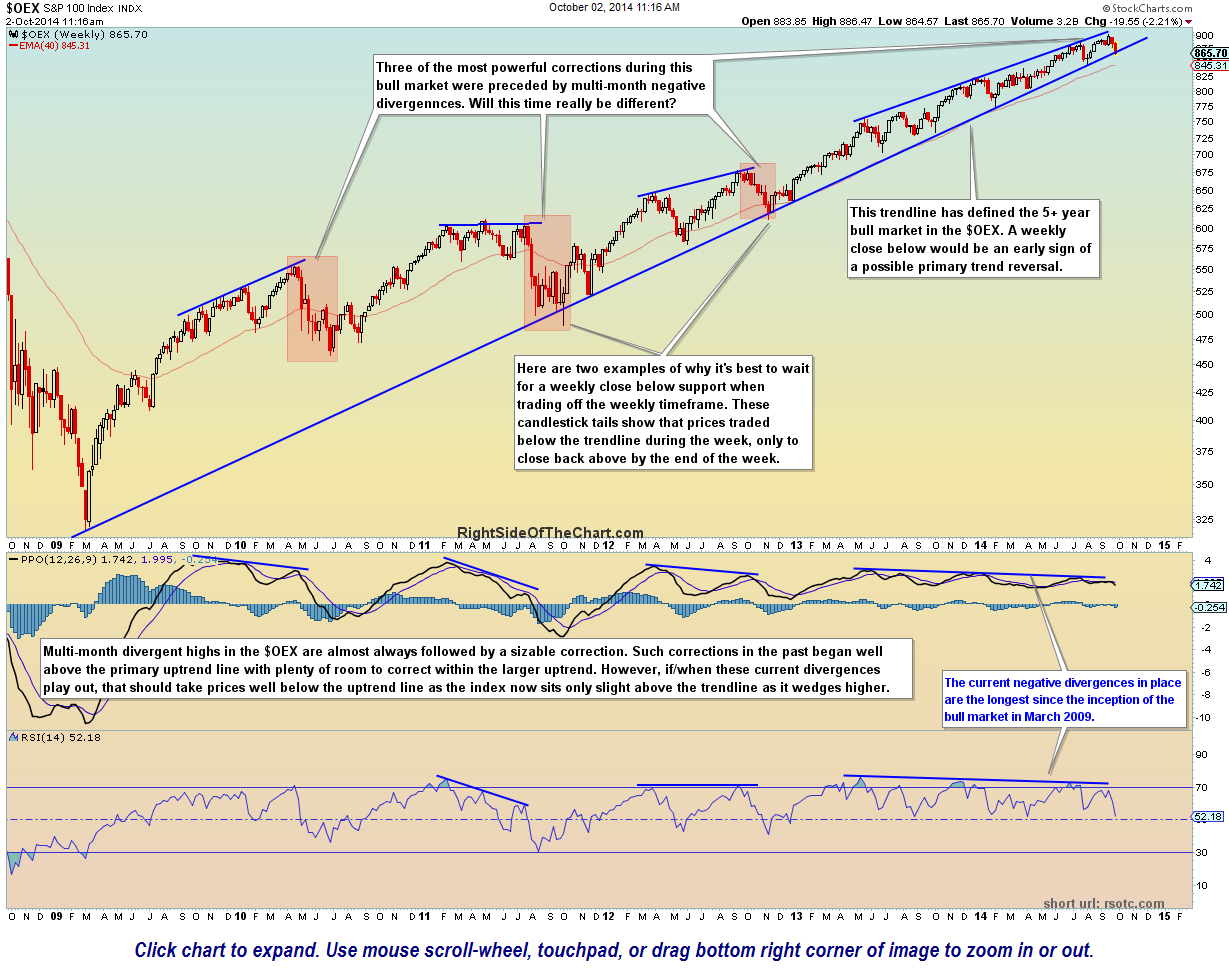
- $OEX weekly Oct 2nd
During what I believe to be significant moves higher or lower, I look for bullish or bearish divergences on the 60 minute chart as a heads up for a likely counter-trend bounce (or THE end to the move) lasting more than just a few hours. Currently we do not have bullish divergences in place that, coupled with the fact that the major US indices are breaking down below major uptrend lines one after another lately, only reinforces my belief that the recent selling is most likely only the beginning of a much larger correction in US equities. My best guess is that we might have bullish divergences in place once/as prices approach the T3 zone in the coming trading sessions. The current T3 zone is the same as the previous T2 zone which was the final near-term target for the previous correction in the SPY, which was also preceded by a divergence top & breakdown of a technical pattern (bearish rising wedge vs. the more recent ascending broadening wedge). As pointed out back then, we had bullish divergences in place on the 60 minute time frame as prices hit the T2 target zone and those divergences (and tag of key support) were the catalyst for the most recent rally in the SPY off those levels.
On a final note, we still don’t have an “all-clear” sell signal in US equities though as I’d like to see, at the very least, a solid weekly close below the $OEX (S&P 100 Index) bull market uptrend line. I always give a much higher weighting to the longer-term time-frames (e.g.- weekly vs. 60 minute). As such, my determination on whether to book profits on a lot of my short trades at the earlier targets or towards the final targets will depend largely whether or not ALL the major US stock indices have broken support on both the daily & weekly time frames.