
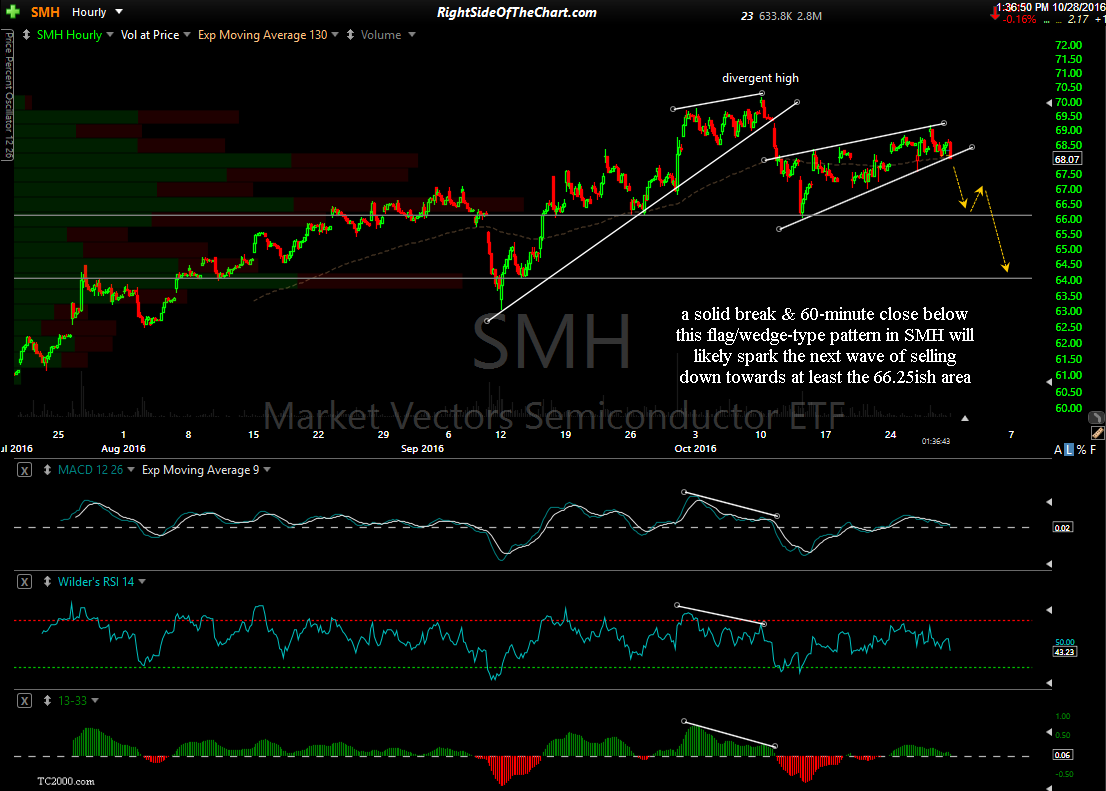
While the recent choppy price action has led to several stop-runs on some of the recent trade ideas, shorts & longs alike, including some of the semiconductor trade ideas, I just wanted to reiterate that the charts still appear to indicate that the semiconductor sector is on the verge of a major correction. Since the semiconductor sector (via the etfs; SMH, SOXX & XSD) made clear & impulsive breakdowns below well defined uptrend lines/wedge patterns recently, they have been flagging in what appears to be a continuation pattern similar to a bear flag. A solid break & 60-minute close below this flag/wedge-type pattern in SMH will likely spark the next wave of selling down towards at least the 66.25ish area, therefore offering the next objective short entry or add-on to the SMH/SOXL short trade.
-

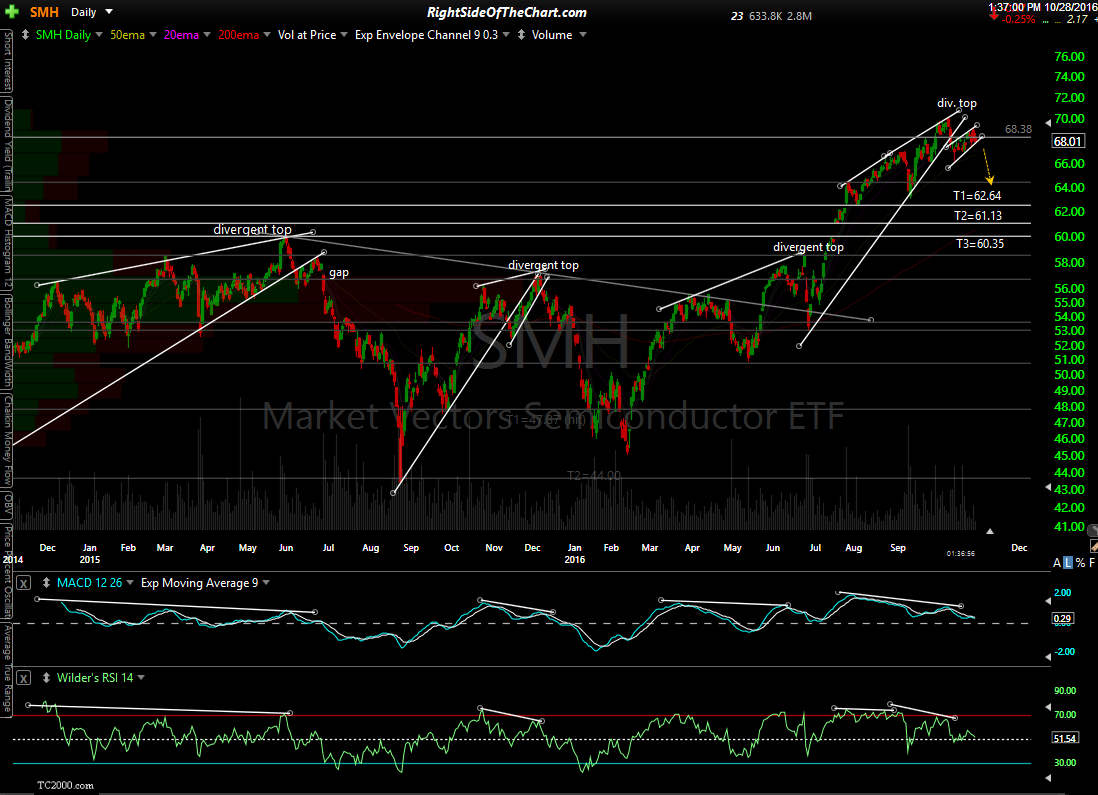
- SMH daily Oct 28th
-

- SMH 60-min Oct 28th
The charts above show these patterns on the daily & 60-minute time frame. As I often say, suggested stops & profit targets are just that, suggested. Each trader should use stops & profit targets that are inline with their own unique risk tolerance & trading style. While some of the semi short trade has recently exceeded their suggested stops, I plan to give my positions a little extra wiggle room for the time being until & unless the current bearish technical posture of the sector begins to dissipate with the semis moving much higher.