
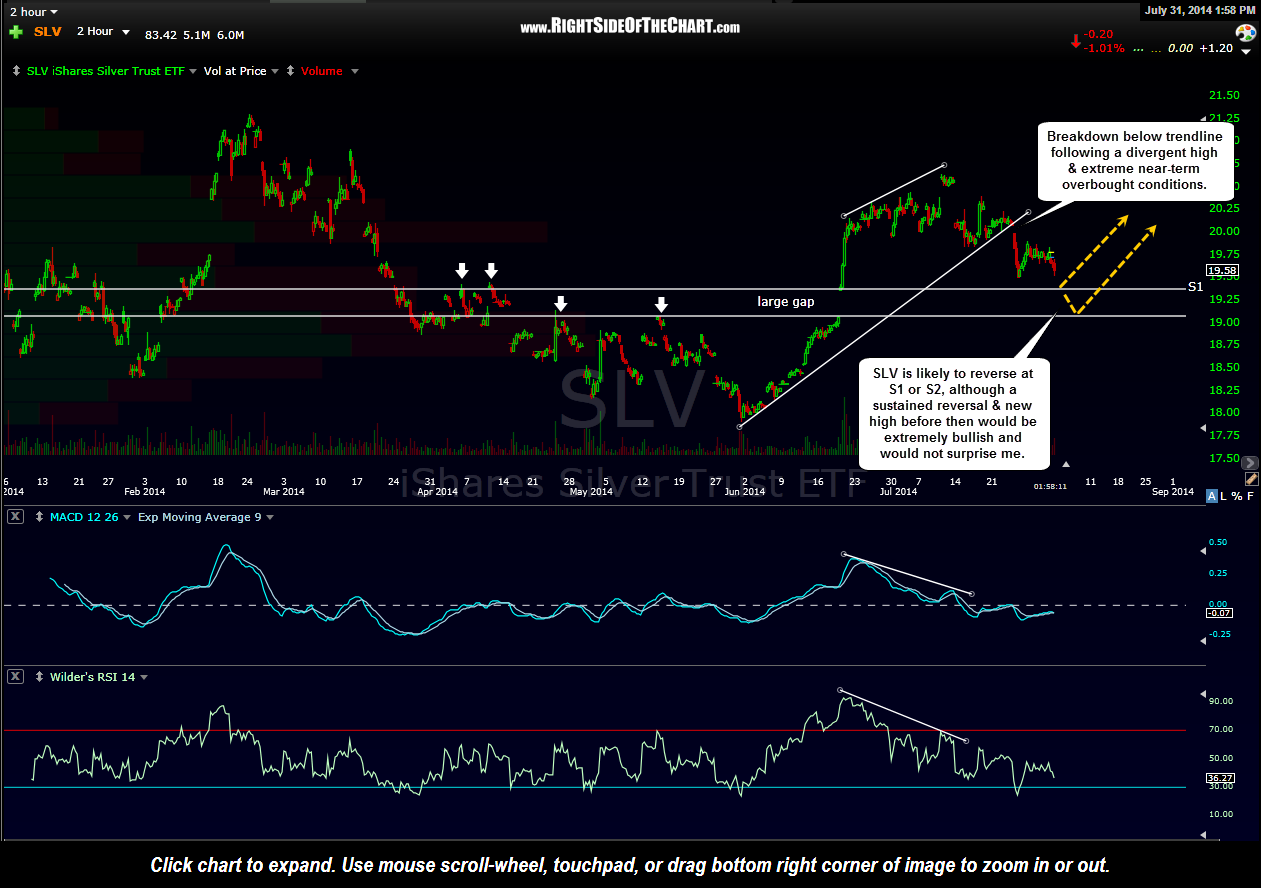
SLV 120 minute chart
As a follow-up to the previous 120-minute chart on GLD, this is the 120-minute chart of SLV (Silver ETF) showing two key support levels, the first of which is not far below current levels. The S1 & S2 support levels (1st & 2nd support) are defined by the large gap from June 19th as well as several previous reaction lows & high on the silver ETF. Although I had not drawn the similar uptrend line on the previous posted 120-minute GLD chart as is shown on this 120-minute SLV chart, GLD did also recently experience a breakdown (and backtest) of a similar uptrend line also following a divergent high & extreme near-term overbought conditions. (I also pointed out that comparable uptrend line break on the 60 minute GDX chart towards the end of yesterday’s video).
Those breakdowns, especially following the divergent highs & overbought conditions, were unarguably bearish technical events and as such, prices have moved lower since. With that, I’d imagine that bearish sentiment on the metals & miners ramped up considerable in the last few days in addition to a flurry of selling (by both longs & shorts) in GLD, SLV & the miners.
If a new cyclical bull market in gold & silver is indeed underway, then my expectation would be to see this current downtrend in the metals & miners reverse at or quite possibly before the lower support levels shown on these 120-minute charts. Should GLD & SLV reverse shy of those support levels and relatively quickly go on to take out the recent July 10th reaction highs, I would view that as very bullish price action, with the next & final key resistance area (which would trigger a powerful longer-term buy signal) being the March 13th & Feb 24th highs in GLD & SLV (respectively).