
I’ve covered gold & the mining sector quite extensively lately so I figured that with SLV breaking below it’s mid 2013 & mid 2014 double bottom lows today, I will focus on the “other” shiny metal. By all accounts, today’s price action in SLV (Silver ETF) is bearish… a breakdown below a well defined, uber-watched support level on above average volume. Sell signals don’t get much more clear than that. However, as with gold, I would not be the least bit surprised to see silver break down & even trade below that key support level for several days, possible even several weeks. Assuming that gold & silver are in the latter stages of the cyclical bear market that began in 2011, such a break of support could prove to be a very bullish longer-term event, serving as a wash-out move to shake out the last of the weak-handed longs & usher in a new wave of short selling, the latter of which could provide the fuel for a strong short-covering rally should silver manage to regain this broken support level. Ditto holds true for gold although the “shiny-er” metal is still trading somewhat above its comparable mid & late 2013 double bottom lows.
In this weekly chart of $SILVER (spot silver prices), I have outlined what I believe to be the three most probably scenarios for silver. The first & most likely scenario would be a reversal from at or very near current levels, with today’s break of support being reversed relative soon, by the end of next week latest. That allows for a little more downside in silver as well a gold, which would likely bring to gold to a test of the mid/late 2013 lows. The second most likely scenario (which I’d have to give nearly equal odds to the first now that support has been lost) would be for a half-decent washout move lower that could last as long as a few weeks, although probably not much more than a week or two, bringing $SILVER down as low as the 16 area. Such a move would still have very strong bullish divergences in place on the weekly PPO & RSI, as well as some other key indicators. The most bearish scenario would be that the recent consolidation in silver prices since the late June 2013 lows was simply a bearish consolidation pattern (a large descending triangle) in a much larger bear market, possibly even a new secular bear market. If so, prices are headed much lower over time and may work there way down within this large descending price (bounded by the blue & red downtrend lines). Note: $SILVER is an end-of-day (EOD) chart, with prices updated each evening. The live, annotated version of this chart is also available from the Live Charts page.
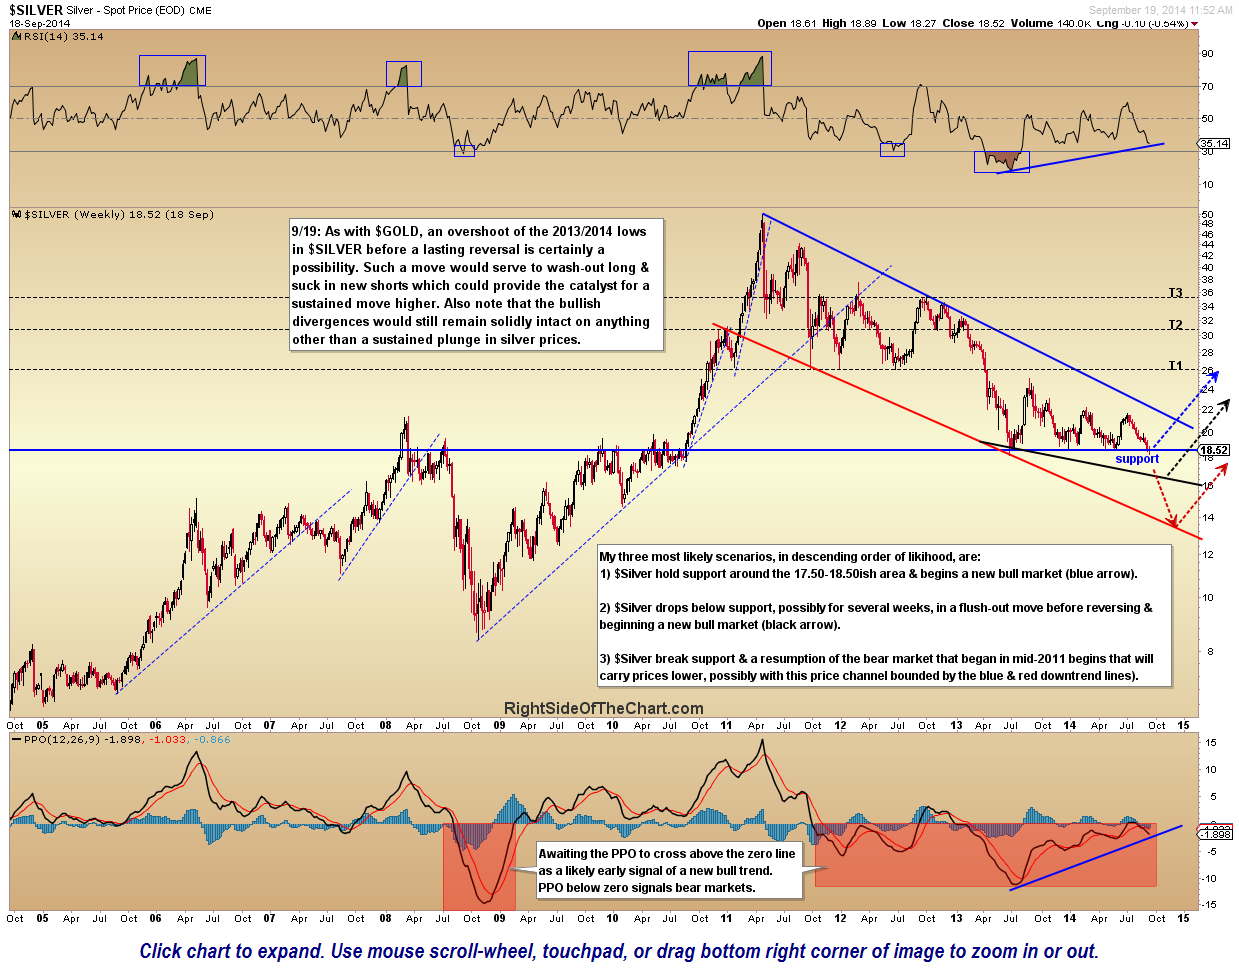
$SILVER weekly Sept 19th
Another reason for allowing a little more wiggle-room on gold, silver & the mining sector before throwing in the towel would be my take on the US Dollar. The inverse correlation between the $USD & gold, along with an analysis of the dollar, was recently covered in this Sept 10th update. The 10-year weekly chart of UUP (US Dollar Index ETF) is similar to the monthly chart of the $USD from that previous post and also shows UUP at the same multi-year downtrend line resistance as $USD. Besides the fact that the dollar has made a very strong & extended run into key downtrend line resistance, as this chart illustrates, UUP is extremely overbought with a weekly RSI 14 reading of 78.66. Over the last decade, there have only been two other 70+ overbought readings, both marking major tops in UUP. Conversely, every single oversold (30 or below) reading on the RSI has also marked significant bottoms in the dollar. Therefore, the dollar is at rarely seen overbought levels while at multi-year downtrend line resistance. As with gold, the next major direction in silver will almost certainly be determined by the next major direction in the dollar. Although it seems that the vast majority is bullish on the dollar at this time, resistance is resistance until proven otherwise (i.e.-taken out). As stated previously, my preference is to wait for a solid end-of-month breakout of the $USD vs. an intra-month breakout before conceding to the fact that the dollar is likely going much higher.
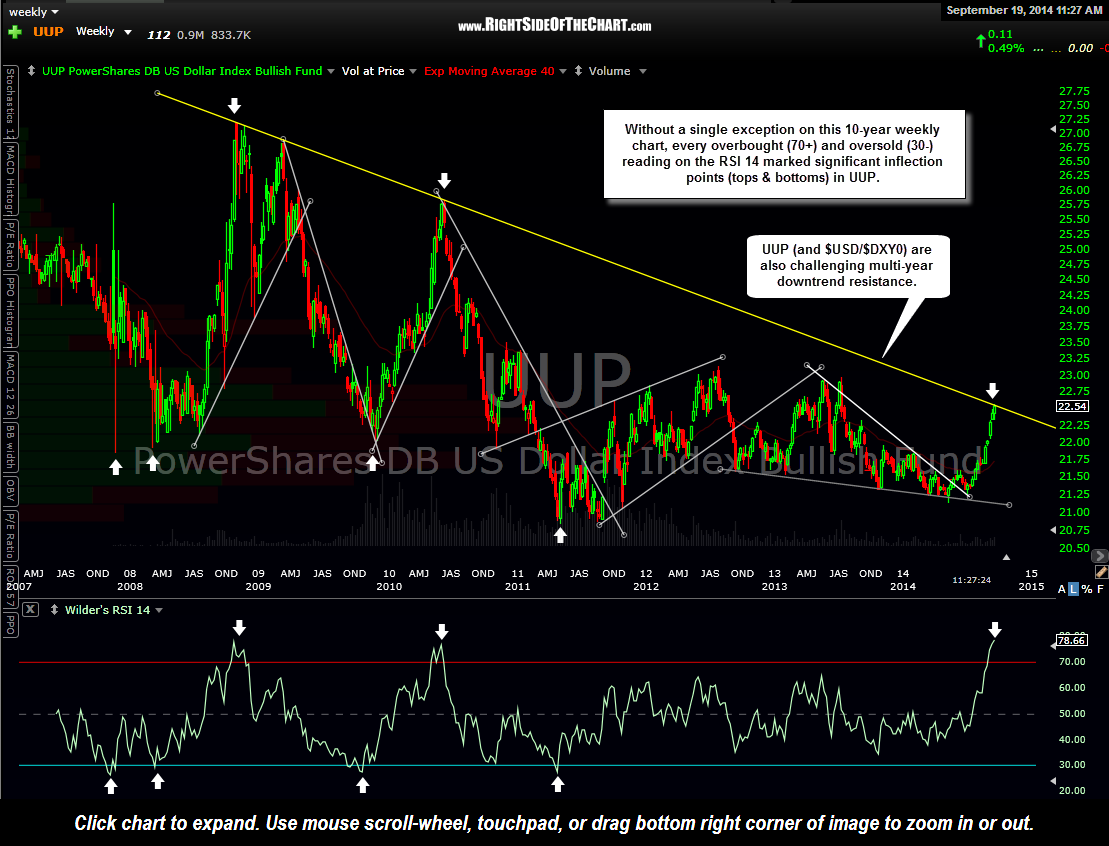
UP 10 year weekly Sept 19th
This final chart simply highlights the aforementioned inverse correlation between the $USD and silver prices. For a more effective visual of this inverse price correlation, I overlaid UDN (the inverse US Dollar Index ETF) with SLV (Silver ETF), as this presents the price relationship as positively correlated and easier to view vs. one price rising while the other falls & vice versa.
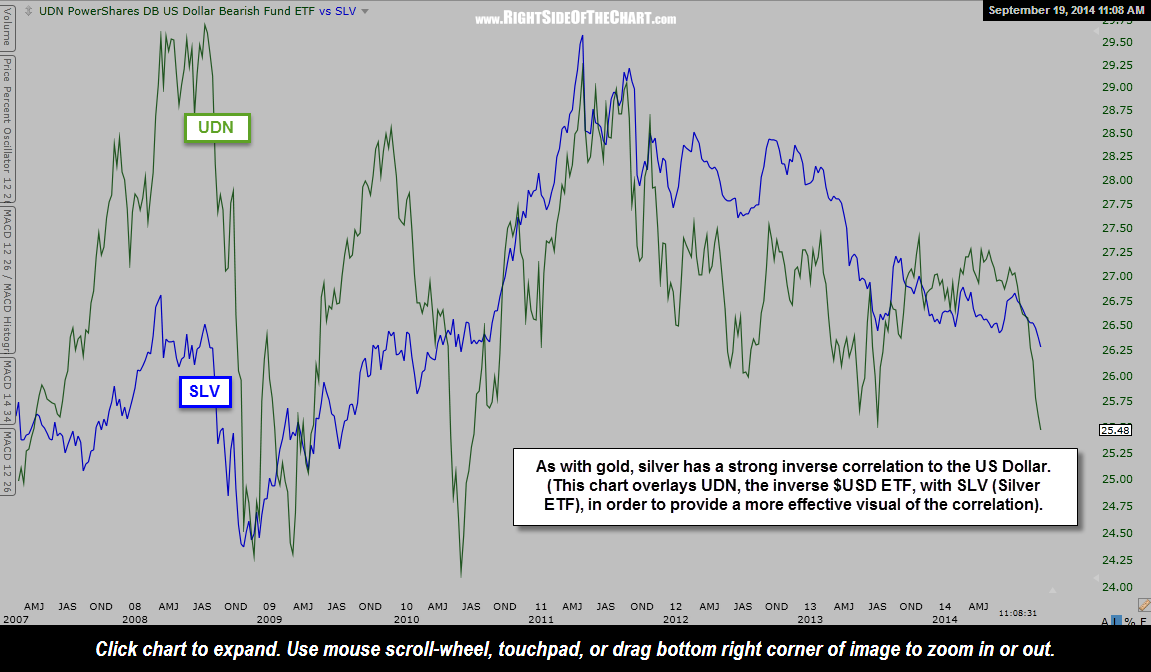
UDN vs. SLV Sept 19th