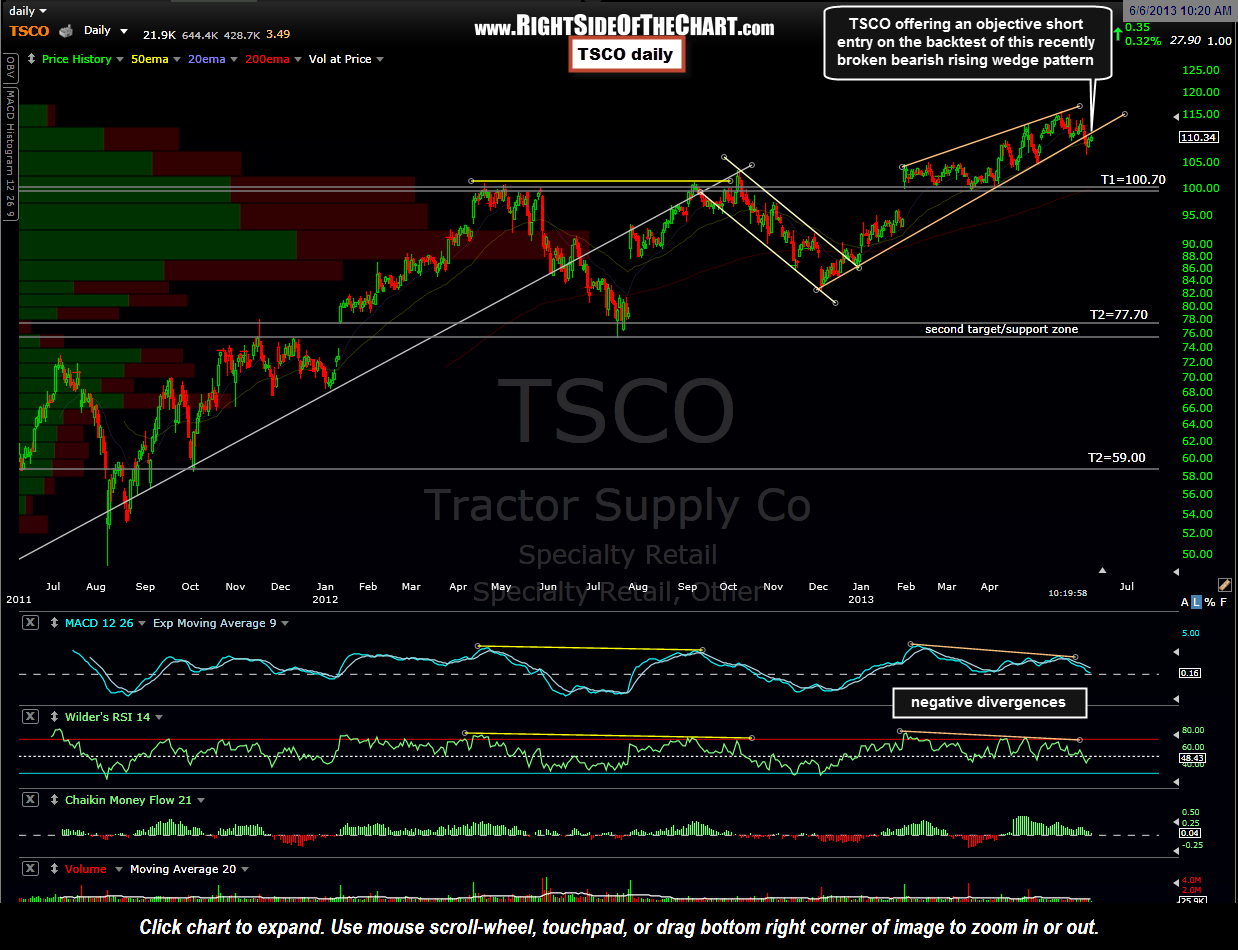
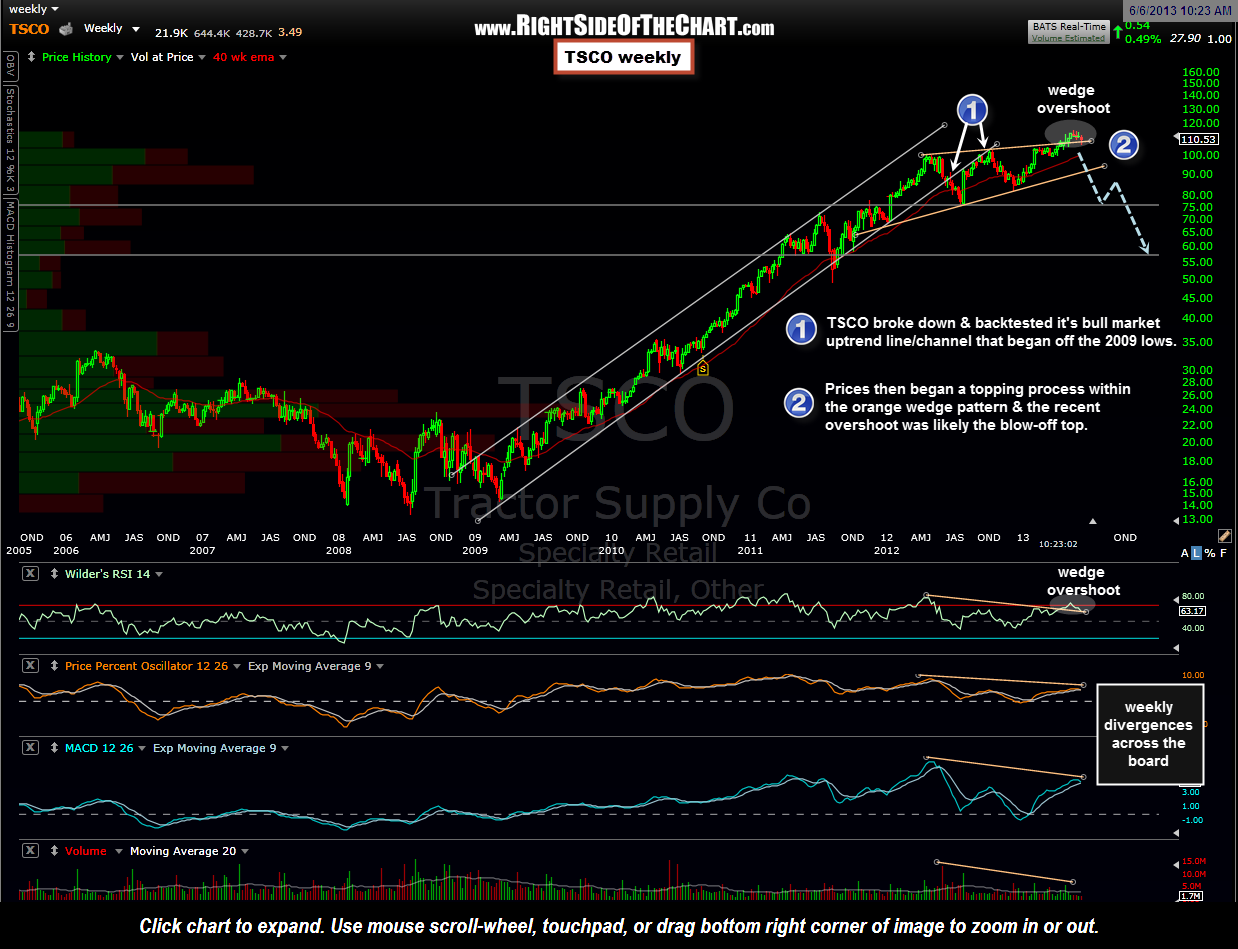
TSCO is offering an objective short entry here on the backtest of this recently broken bearish rising wedge pattern (daily chart). Although I have listed a near-term, high-probability target (T1 at 100.70), I believe the weekly chart helps affirm the case that TSCO is likely in the final stages of a longer-term topping process and as such, I have added some longer-term, high-gain potential swing targets. Stops would be dependent on one’s preferred target(s). e.g.- A shorter-term trader or someone only expecting a brief pullback in the market before it goes on to make new highs in 2013 might target T1 (about 10 pts lower) with a stop around 3 pts over current prices while a longer-term trader agreeing with my take that TSCO has likely topped might target T2 and/or T3 with a stop somewhat above the recent highs, say on a move over 120. Daily & weekly charts.

Results for {phrase} ({results_count} of {results_count_total})
Displaying {results_count} results of {results_count_total}