
In the previous post discussing the recently triggered IIAA Sentiment Extreme Sell Signals, I mentioned how those signals can take up to several weeks to manifest in the form of a trend change and that they are not to be used as exact timing indicators. That indicator can be used by different traders or investors in different ways. For example, longer-term swing traders, trend traders, or investors might use the buy (sell) signals to start accumulating (booking profits) on long positions following buy (sell) signals. More active traders, like myself, will use those signals to be on the lookout to prepare for a potential trend reversal, as the most powerful moves often come in the early stages of such trend reversals. However, it is not uncommon to also see some of the most powerful moves in an uptrend or downtrend come in the final stages (i.e.- a blow-off top or bottom). Therefore, being too early or jumping the gun without some other types of confirming buy/sell signals can be very costly, assuming that one throws in the towel just before the reversal finally takes place.
There are many ways to utilize this & other buy or sell signals depending on how one is positioned but for the sake of this example, let me share my strategy. I’m currently & have been running a net short portfolio for weeks. Net short means that I have more short exposure than long exposure although I do own both longs and shorts. In fact, although I current hold more short positions than longs, my trading account has a decent gain on the day due to the big gains in such positions as WLT, CLF, HL, AEM & SLV (and some others outside my trading account) while most of my shorts, such as the airline stocks, are up much less than the broad market.
Although many of the charts on these positions are looking very bullish, as of today’s second consecutive 18%+ bull/bear sell signal I will be looking to book partial or full profits on some of these trades sooner than later, quite likely before even the previously posted first targets. I will try to update as many active trades as possible soon but my thoughts are that the risk/reward to remaining long is rapidly diminishing. However, as stated recently, I am not adding short exposure here either, as the short-term trend by just about all metrics that I follow is no longer bearish.
Yesterday I posted a 15 minute SPY chart listing 4 criteria that I was waiting for in order to confirm a likely resumption of the downtrend. At the time of posting, we had just triggered one sell signal via a break below a well defined uptrend line. However, although we came extremely close, not one of the other sell signals were triggered. In fact, if you look at this updated 15 minute SPY chart, you will see that we had a nearly identical “close, but no cigar” pending sell signal a few weeks ago back on June 27th. At that time, we had all three indicators below (144 stochastics, 14-34 ema histogram, and the MACD) all poised to trigger sell signals (as defined in yesterday’s chart/post) at the same time a well-defined uptrend line broke down. However, like yesterday, none of those confirming sell signals triggered and as such, prices went on to make marginally higher highs following a shallow dip. Of course, as prices made those higher highs, the 14-34 histogram as well as the MACD continued to diverge (lower lows) and a confirmed sell signal was given on July 2nd with a break below a new uptrend line as well as all 3 indicators triggering sell signals…. something that I will be watching for going forward.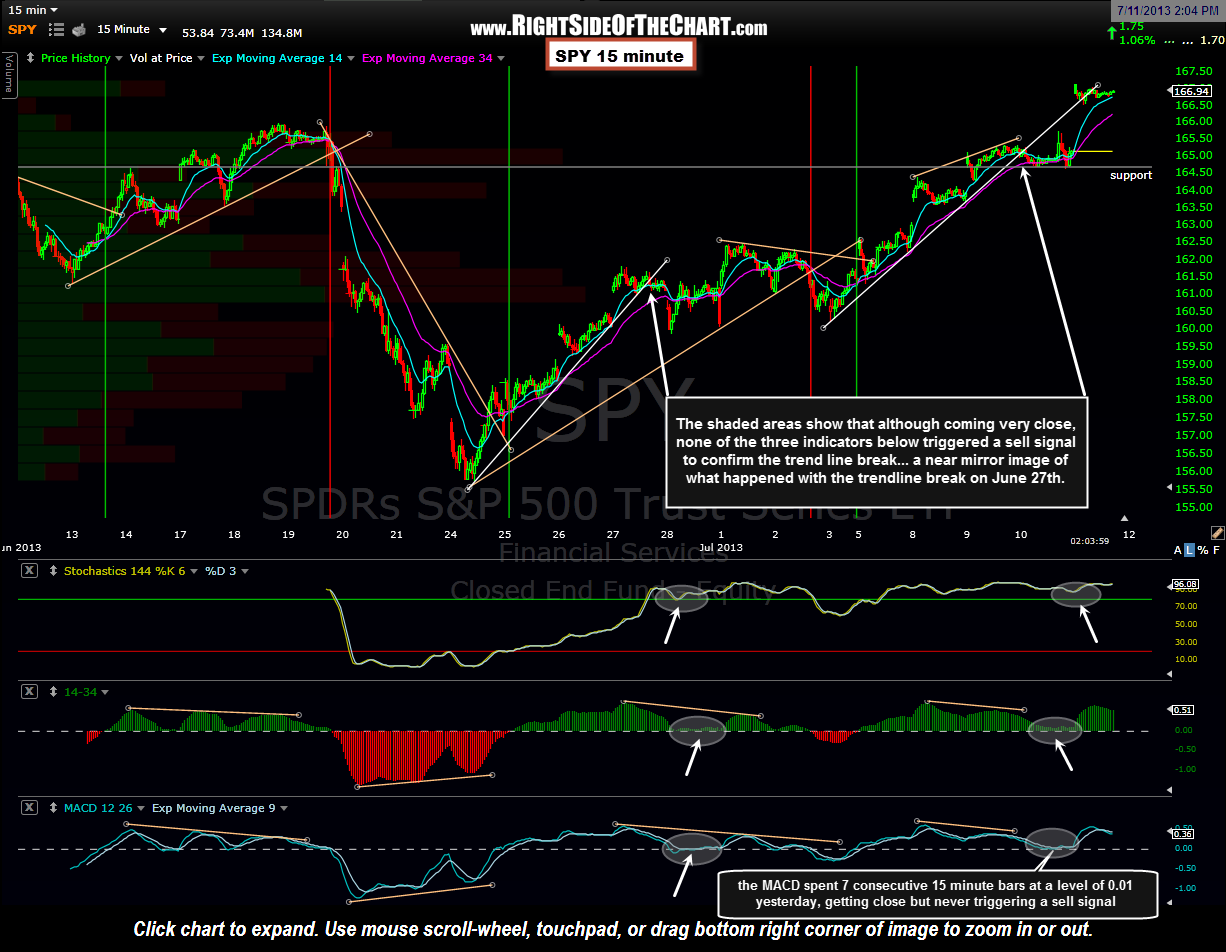 The bottom line is that the recent AAII Sentiment Extreme Sell Signals, as effective has they have been historically, are most effective if/when confirmed by multiple sell signals on the shorter-term time frames, such as this 15 minute chart. Although the sell signals on this chart often trigger in close proximity, ideally you want to see at least 3 of the 4 trigger before aggressively closing longs or adding short exposure.