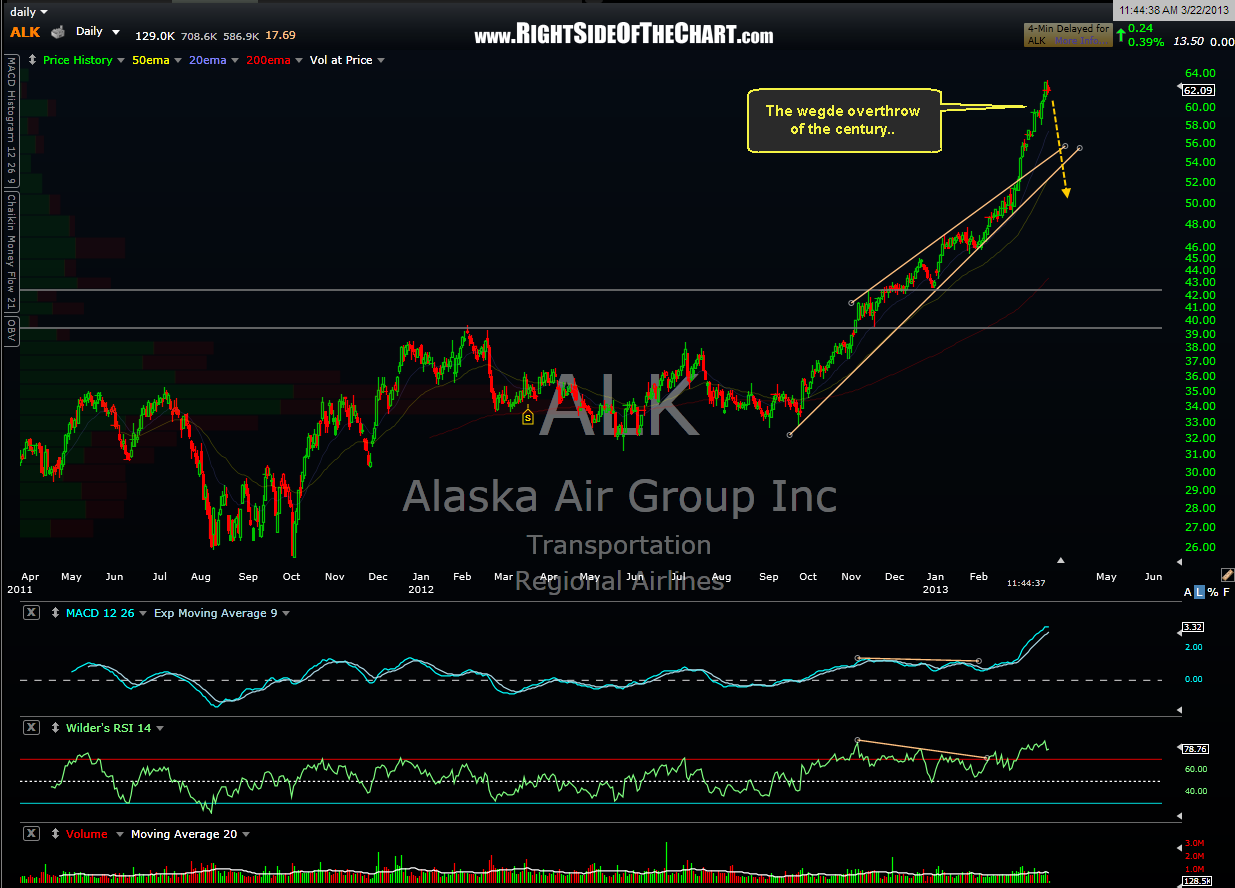
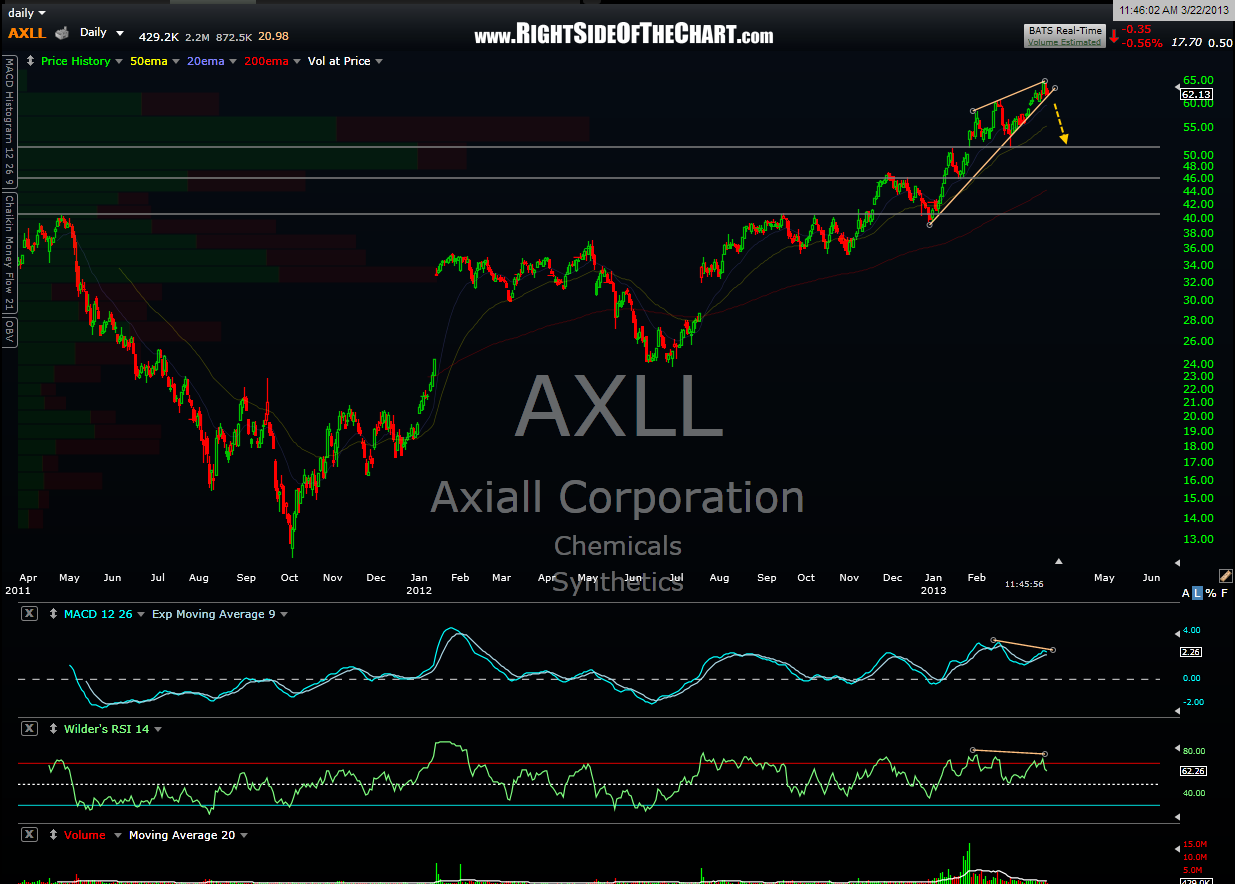
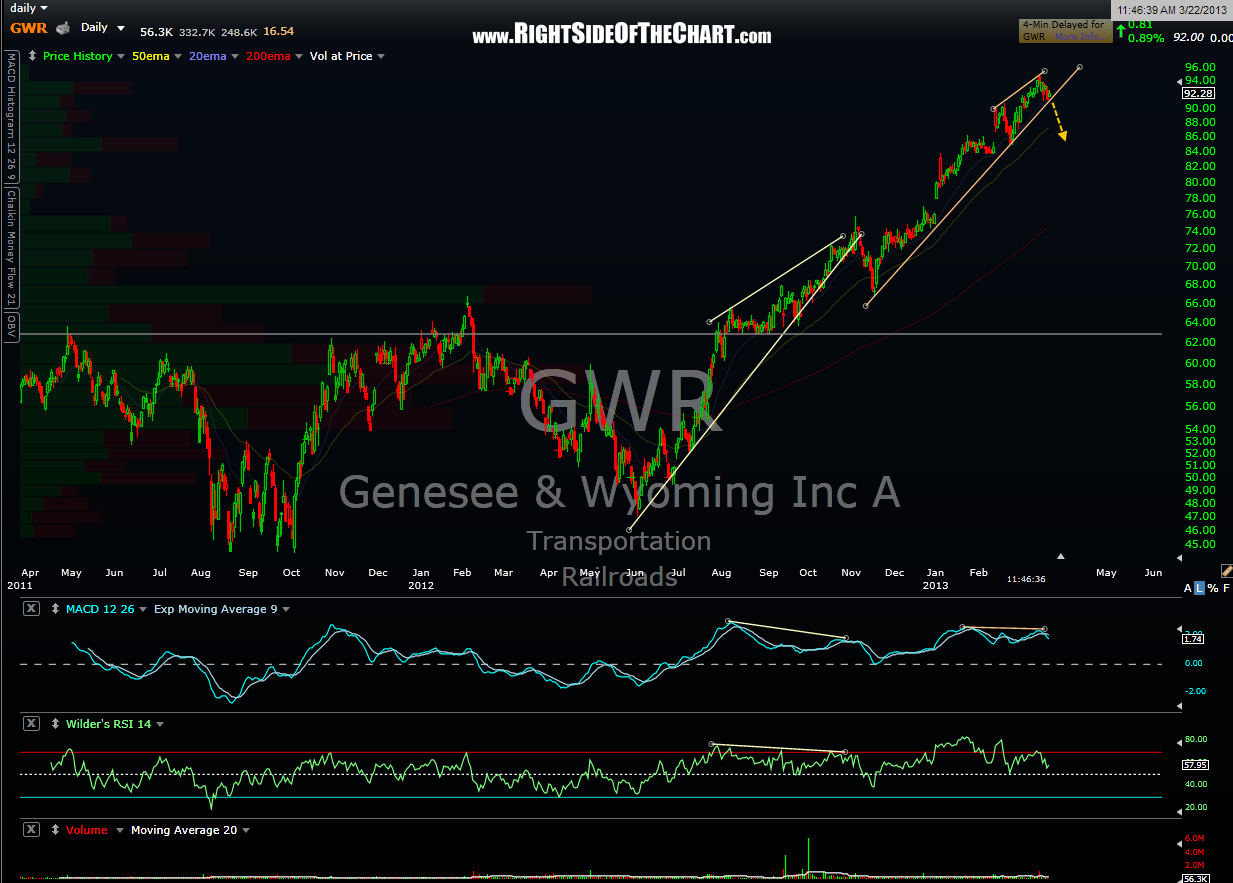
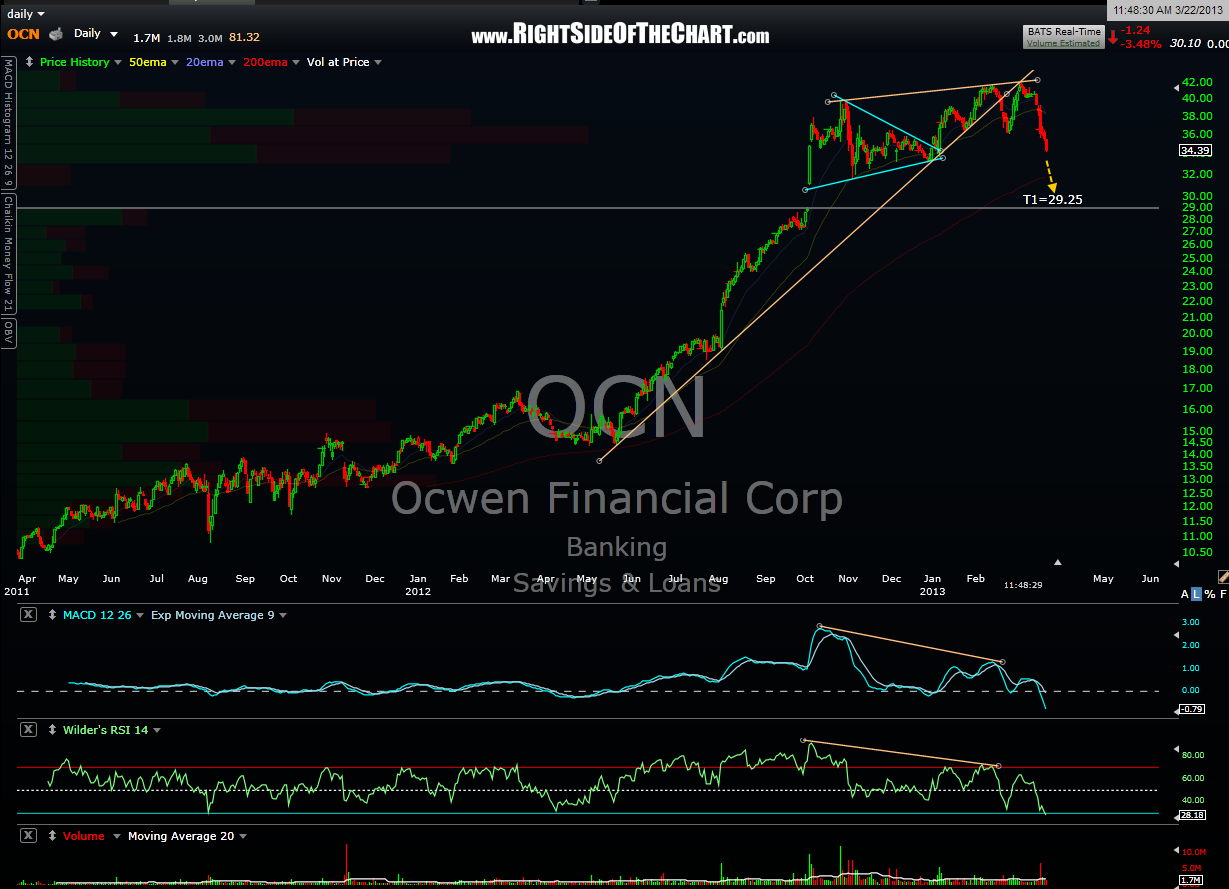
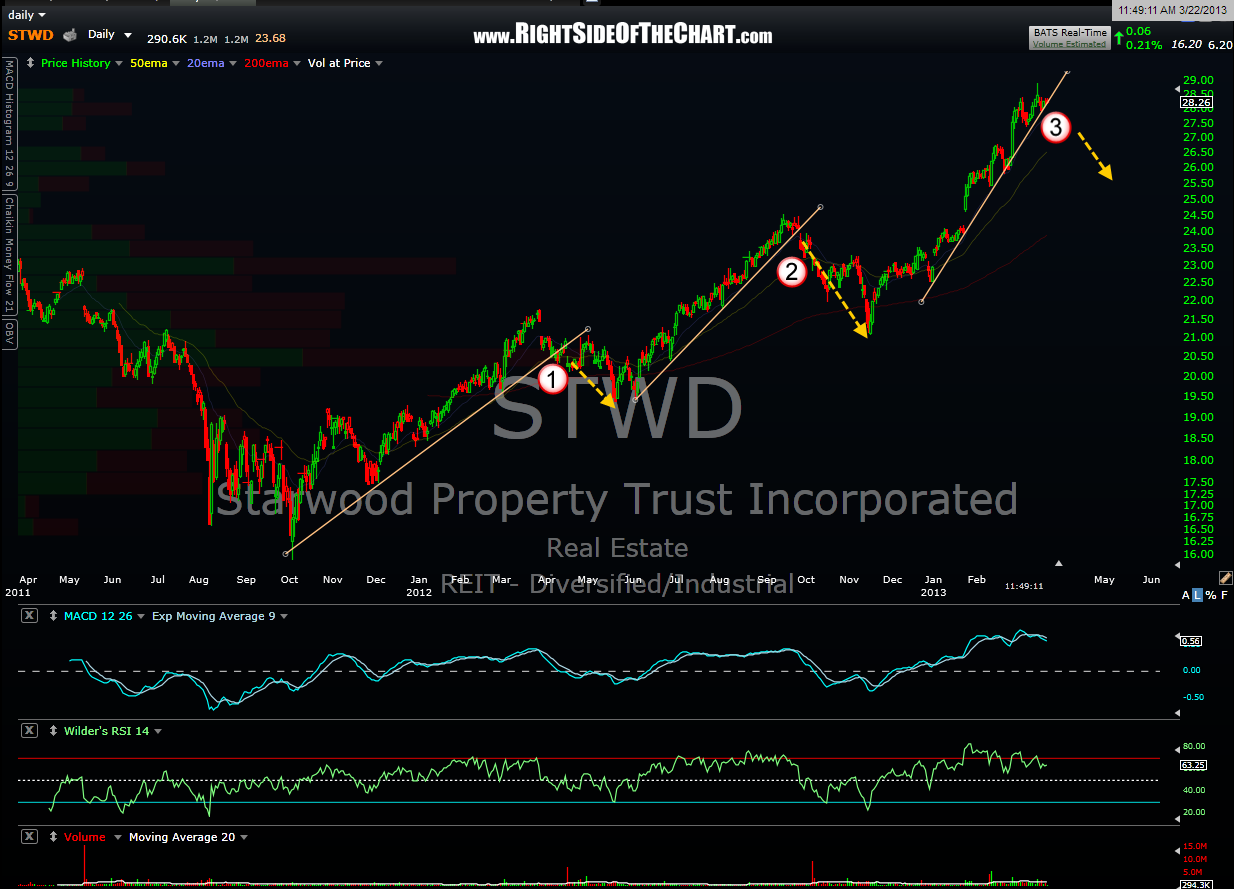
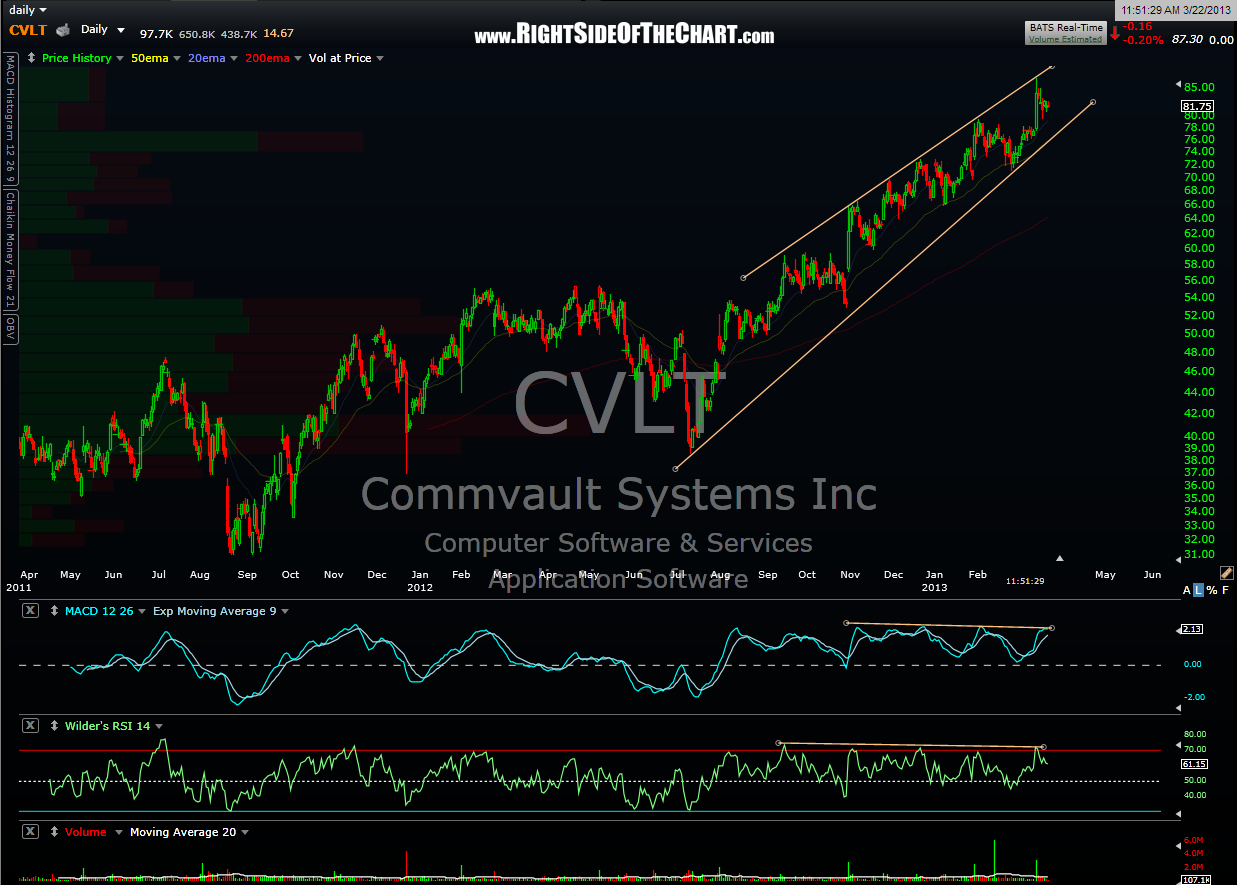
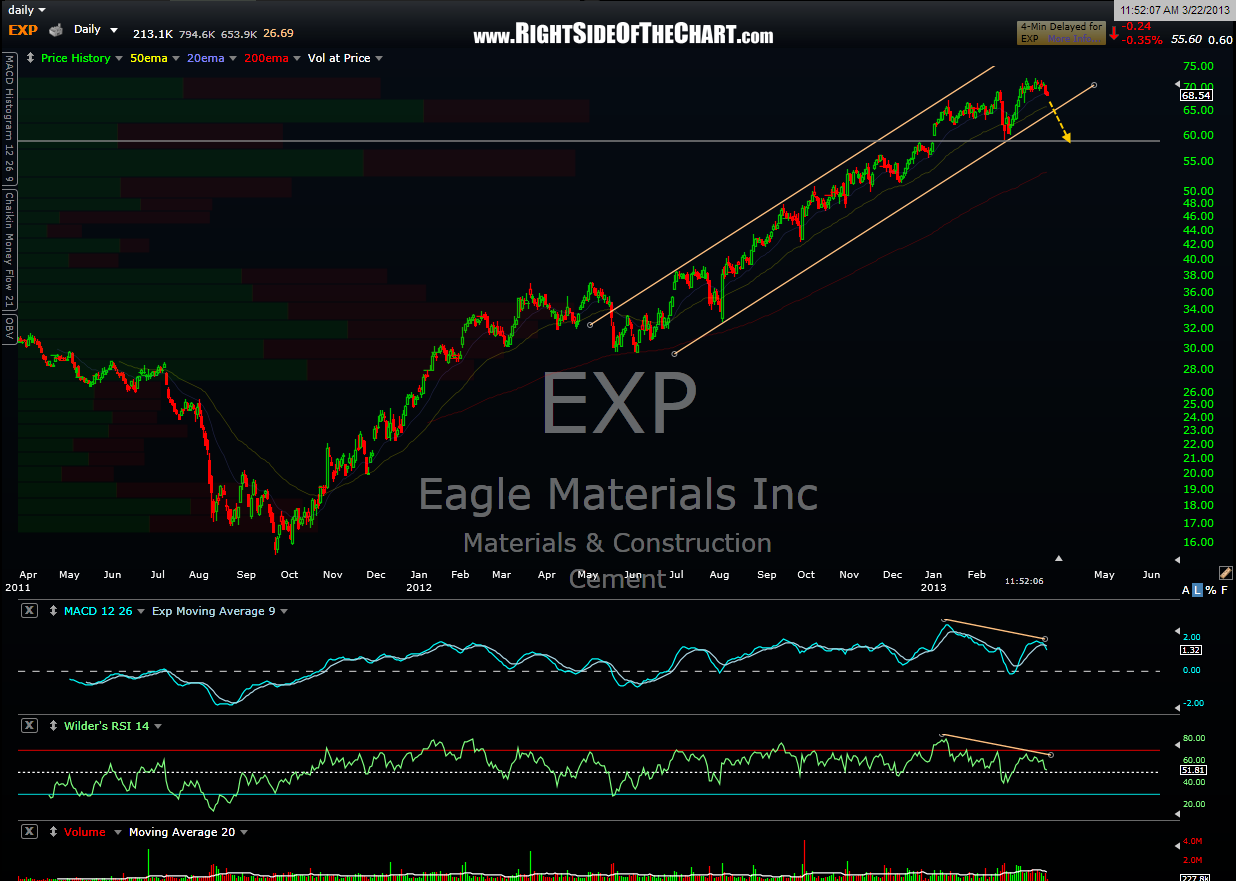
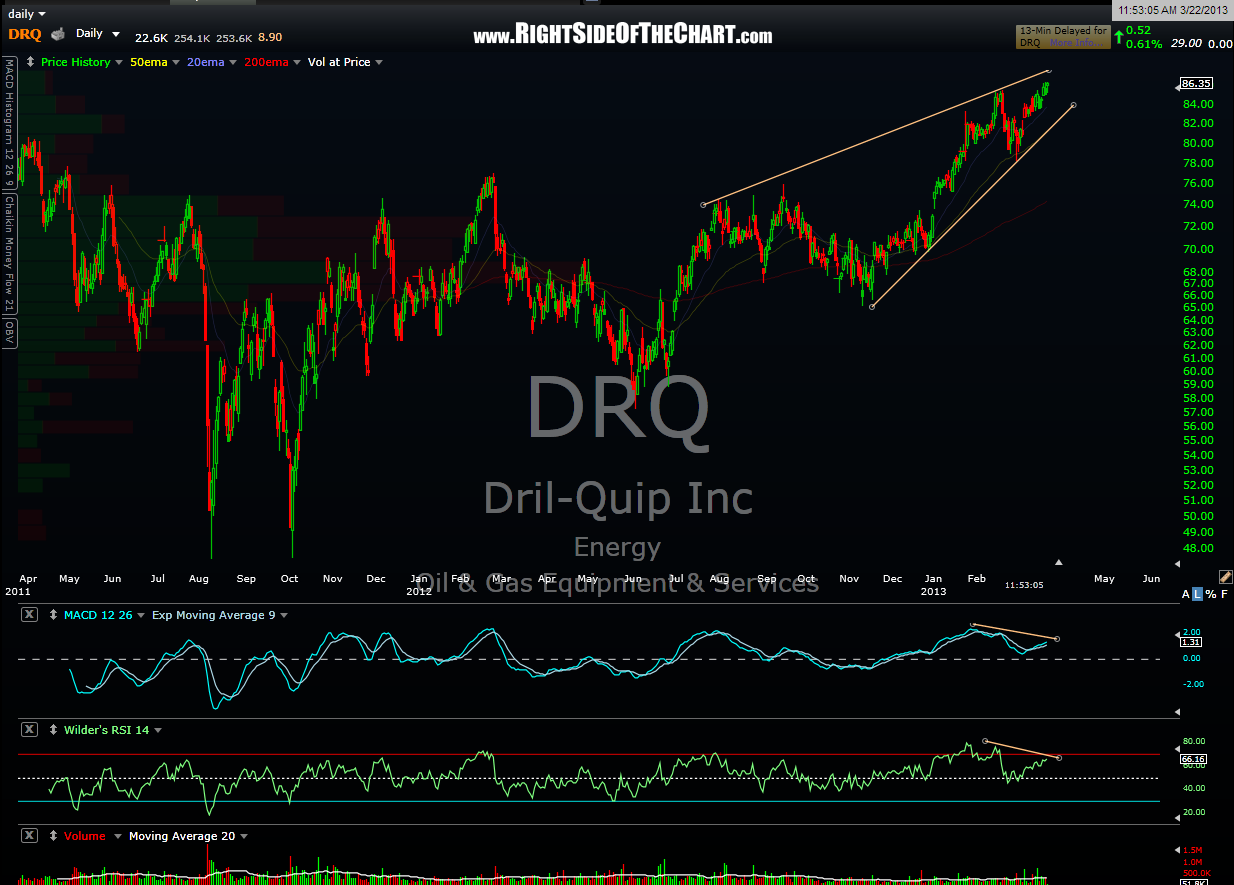
These are the daily charts of the ten largest components of the Russell 2000 Index (posted in descending order by weighting). Rarely have I even seen such screamingly bearish patterns on nearly every top component in a major, diversified index such as this. Of course, these stocks are also extremely overbought on the daily, weekly and even monthly time frames. Personally, I’m expecting much more than the run-of-the-mill 3-5% pullback that most pundits on the street are calling for. As taking screen captures and annotating 10 chart takes a considerable amount of time, my notes on the charts are minimal but I believe that most of these patterns speak clearly.
Many of these charts have some horizontal or uptrend lines drawn below current prices which would act as downside targets, for those interested in shorting or even going long any of these stocks on a pullback (the former being my preference). Although some of the stock have just recently broken below support, typically a key uptrend line, many are still within the patterns with some towards the top of the patterns/trendlines (resistance) while others are close to the lower uptrend lines (support). Therefore, my short on the index at this time is what I refer to as an anticipatory trade (entering the trade early in anticipation of a likely breakdown). However, more conservative or conventional traders might choose to wait until the majority of these stocks have broken below the support levels shown on these charts before taking a full position.