
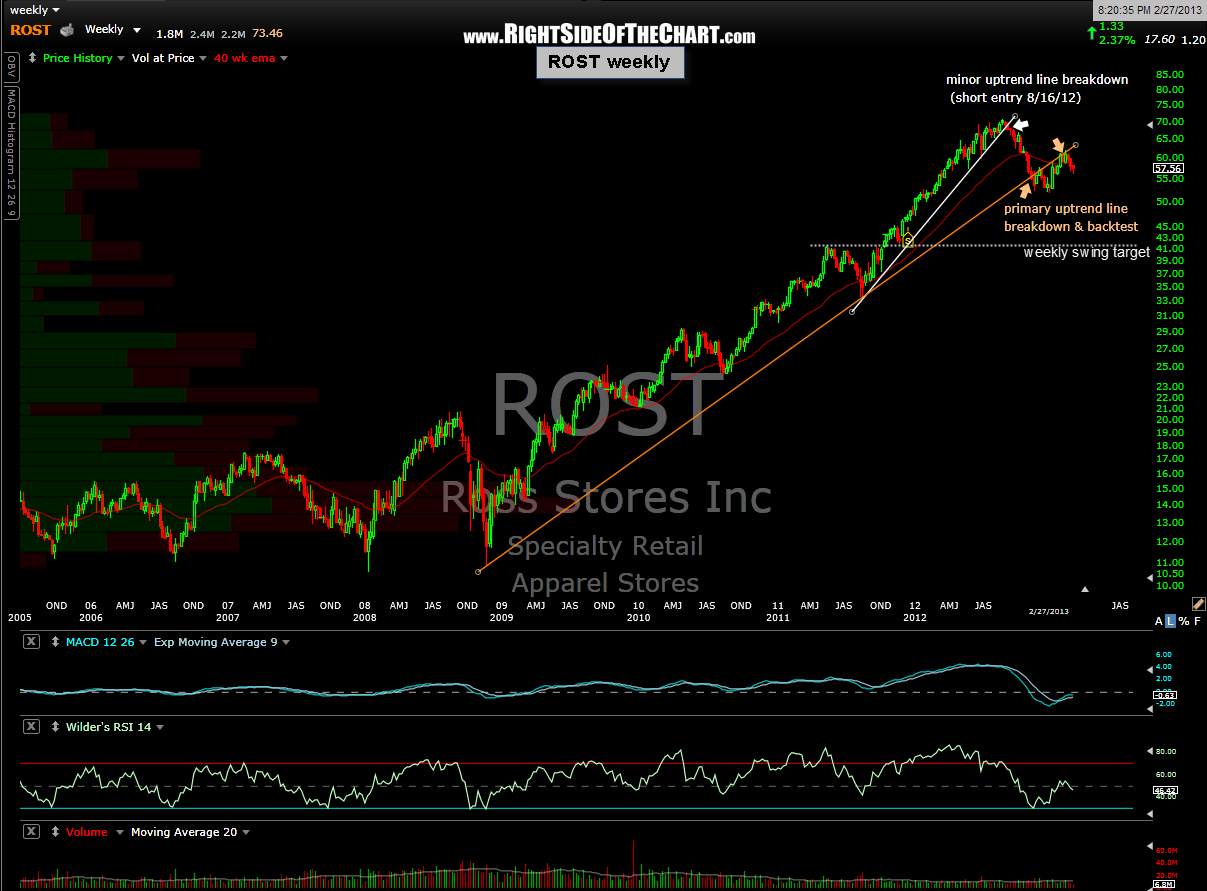
I was asked my opinion on ROST tonight, which has been an active short trade on the site since Aug 16th. In looking over the charts, I figured that not only is it time to update this trade, as the last update was on Nov 15th when it hit the 3rd target for a 22% gain, but there are a few more points that I wanted to share in looking over the charts on this trade tonight. (Notes for the ROST short are on these daily & weekly charts).

To begin with, the ROST trade is a great example of the various ways that one can utilize multiple profit targets often listed on the trade and investment candidates on RSOTC.com. I share this often but as the traffic to the site continues to grow with new users arriving daily, this bears repeating: No two traders or investors have the same trading style, risk tolerance, average holding period, etc… Even my own personal trading style will adjust at times depending on current market conditions. At times, I will favor a quick “hit-n-run” trading style with relatively shallow profit targets, tight stops and frequent trades with holding periods of anywhere from hours to several days. Other times I will trade using my primary style of swing trading with an average holding period defined by weeks to months. Some trades, particularly in my retirement accounts, are what would be defined as investments, with holding periods exceeding a year or more.
Other than the occasional quick bounce trade expected to only last a day or so, like the FSLR long earlier today, nearly all the trades ideas posted here are swing trades or even some much longer-term trades (investments) with expected holding periods of several weeks to several months or more. Most of these trades list multiple targets for, well, multiple reasons. Huh? Let me explain: I don’t expect every one that uses this site to mirror my own trading style or market bias at any one time. More active traders that prefer to enter a trade and exit as soon as possible with relatively shallow, but quick gains might prefer to trade the breakouts of some of the patterns posted here while booking full profits at the first target. This allows them to quickly recycle those profits, along with the capital used for the trade, into the next trade asap.. something that I refer to as velocity in trading.
Another possible strategy is to “tier” your trade by booking partial profits as the various target levels along the way. For example, on this ROST short trade, less-active trader with a longer-term time frame might have covered 1/2 of their position at T2, 1/4 at T3 and let the remainder ride, with the appropriate stops in place, holding out for T4. Another more active/nimble trader might utilize the intraday charts to trade around some of the price target. For example, when T3 was hit, I covered my entire position in ROST because it the trade was already up 22% while hitting the third price target, which was solid support on the daily chart, and most importantly, solid positive divergences had formed on the 60 minute chart (plus, as mentioned on the site at the time, I was booking profits on many of my shorts as the odds for a broad market bounce were increasing). Now, I am considering a new entry if prices break below that 56.10 support level shown on the updated daily chart above, with either the previous T3 or quite possibly T4 (or both) as my target(s).
As I’m hard-wired with an analytical brain, always computing probabilities, let me share this simplistic view on how multiple typically targets work: If a trade has, say, 4 price targets, the odds of the first target being hit (assuming a confirmed entry such as a pattern breakout or pullback to support) might be 70%. The odds for T2 might be 60%, T3 50% and T4 40%. Keep in mind this example is a very generic, oversimplification as the particular dynamics and probabilities on every trade are unique.
Now, based on what I just mentioned, you might say “Why would I ever hold out for a profit on a trade with less than a 50/50 chance of success? (T4 was 40%). The reason for that has to do with the R/R, or risk vs. reward of the trade. All things being equal, you would be foolish to take a trade with a 40% chance of gain and a 60% chance of loss. However, in trading, all things are not equal… specifically, the amount of money that you are at risk for losing if the trade goes back vs. the amount of money that you stand to make if successful. Clear as mud?
Look at it this way: The typical minimum R/R that I will allow on a trade is 3:1, meaning I’ll risk $1 of loss to make $3 of profits. Therefore, if a particular trade has a 40% chance of playing out, then on $10,000 with a 30% profit target, I have a 40% chance of making $3,000 and a 60% chance of losing $1,000. I’d only have to hit one winner for every 3 losing trades just to break even. Now, if by some crazy chance you are still following or even reading this, let take it just one more step further. As mentioned above, the odds of a first target on any given trade being hit before getting stopped out is greater than the odds of the next target being hit and so on. However, those generic probabilities above (70%, 60%, 50%, 40%) are dynamic, not static. If those were the probabilities assigned to those price target being hit upon a confirmed breakout of the technical pattern, then as (if) the trade continues to play out as expected, the odds for the higher targets increases as the trade plays out. There are several factors that lead me to draw this conclusion, not the least being my experience with trading literally thousands of breakouts and other technical patterns over the years but for a more simplistic explanation, think of it this way: If you enter a long-side break at $100 with price targets at $110, $120, $130 & $140, at the point you entered, the odds of that stock going to $140 (40% gain) are considerably lower than at the time the stock hits T3 ($130, which now takes only a 7.7% gain to get there).
I hope this helps with understanding the reasoning behind listing multiple targets on the trade ideas posted on Right Side of the Chart. Believe me, my primary focus is to offer streamlined, simplified and straightforward market analysis and trade ideas. I imagine that the multiple targets can be confusing to those new to trading, investing or technical analysis and I fully acknowledge that in the real world, my own trading included, it not so easy to know which target(s) to take profits on and when to sit tight and hold out for the “big gains” offered by the final target on some of the 50%+ trades posted here. The best I can do is share my preferred target on a trade and try to post/email out updates asap when that preference changes (like the recent early exit on FSLR, which hopefully helped some side-step the ensuing 25% plunge.) Remember, never enter a trade or investment that does not fit your own unique trading/investing style, risk tolerance, time horizon, etc.. The trade ideas and market analysis posted here are my thoughts and views on the financial market and/or specific securities and are not recommendations for anyone to buy or sell any security.