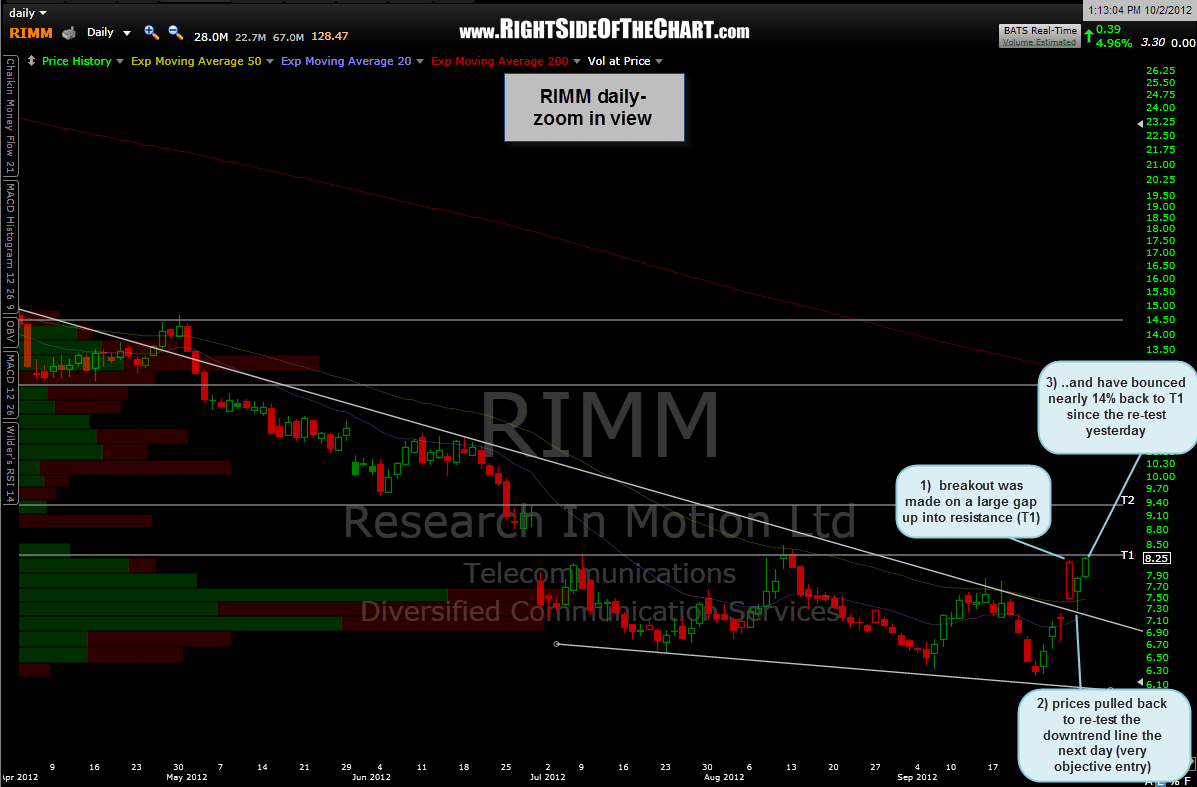
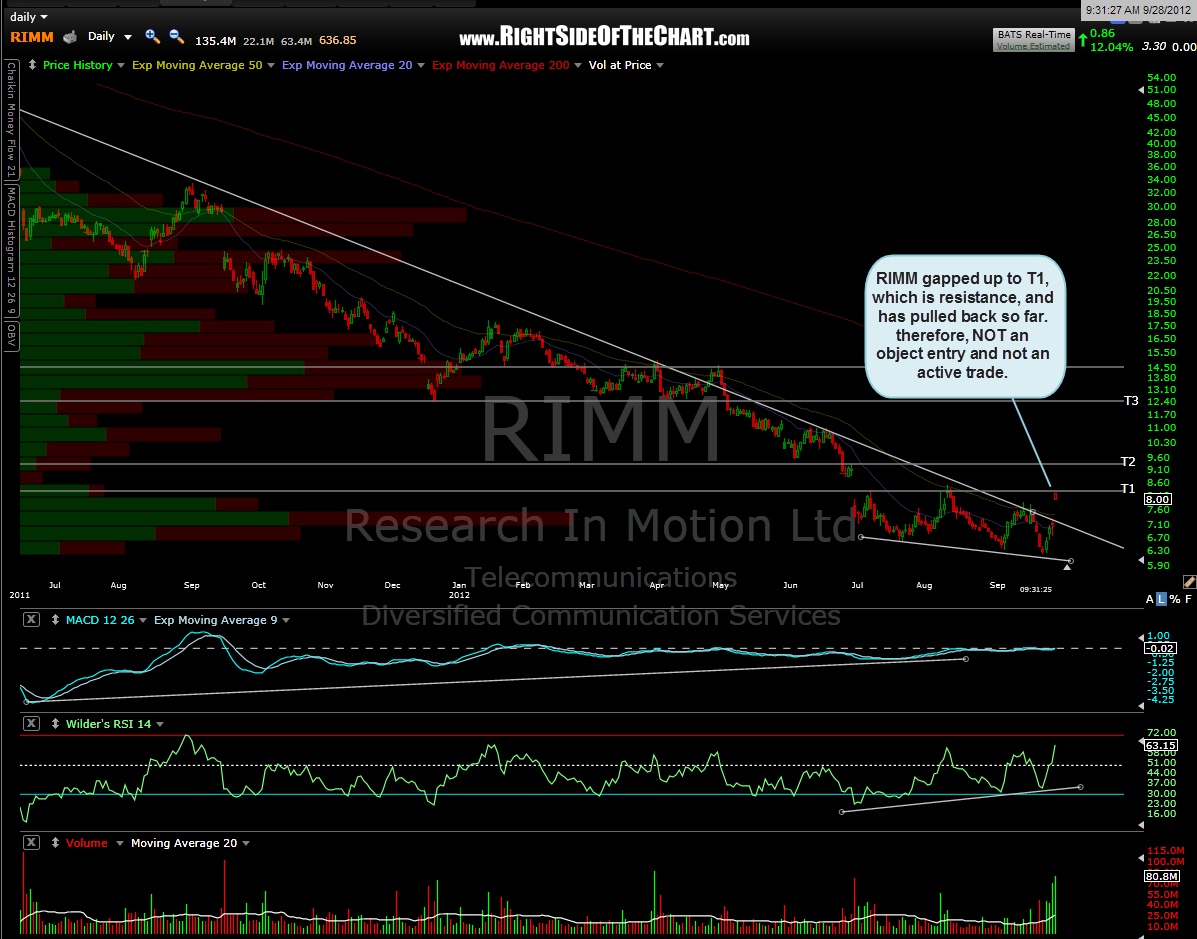
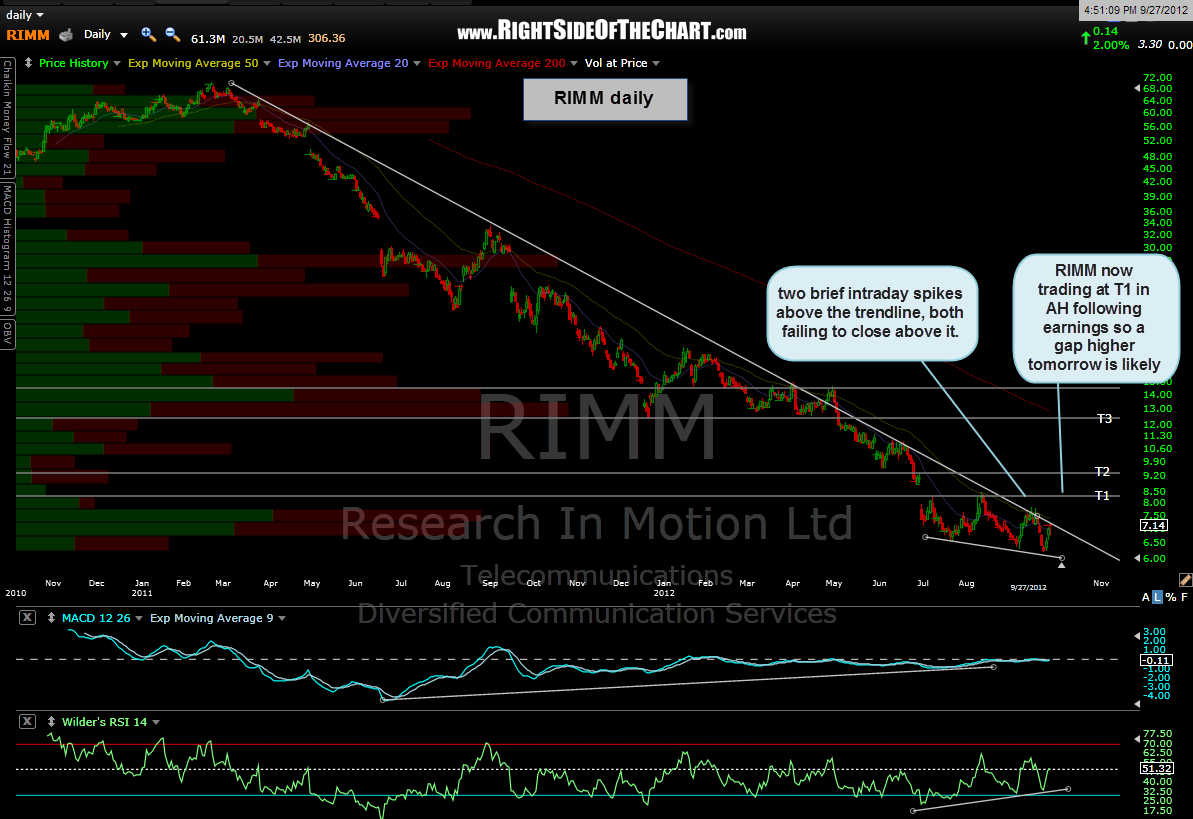
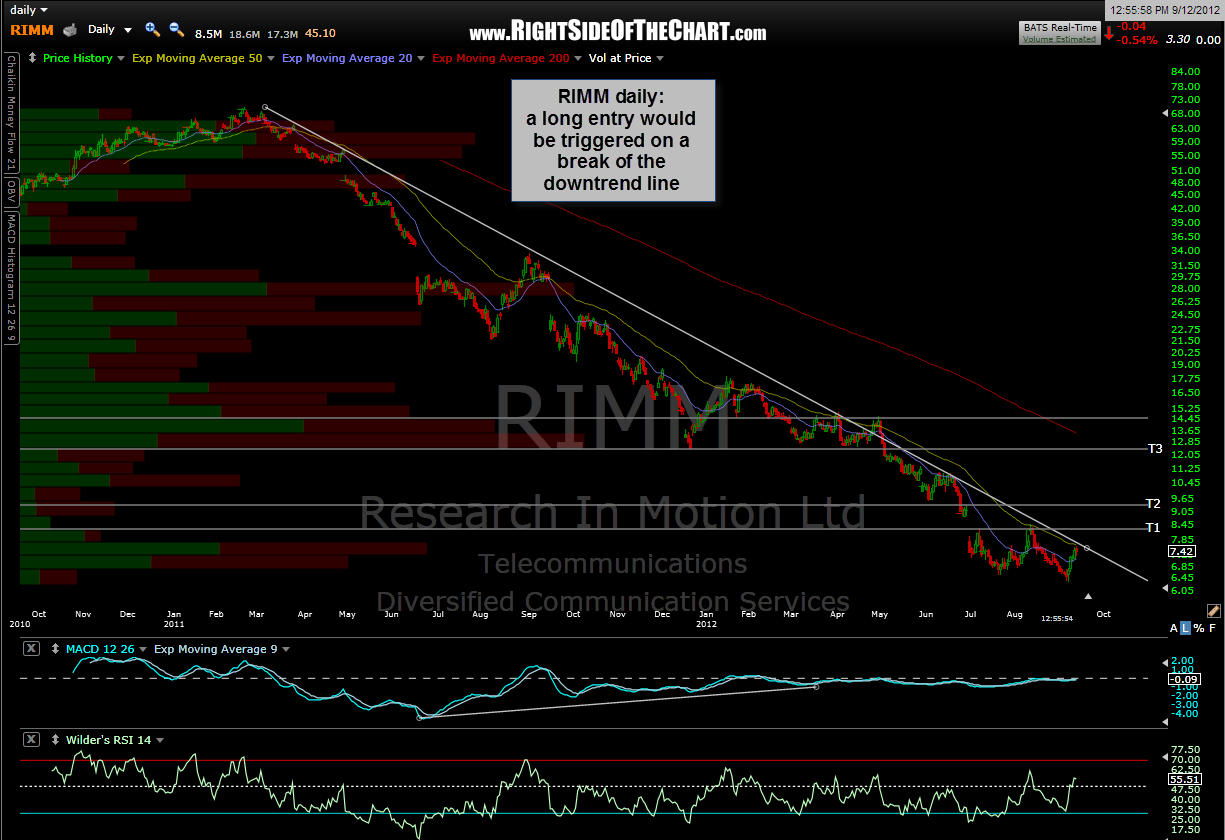
Ah, the one that got away… at least for me. However, some traders may have caught the RIMM long trade, originally posted as a setup on Sept 12th. On Sept 27th, I posted that RIMM was trading up very sharply in after-hours and would gap up too far above the pattern to trigger an objective entry. I had said that the stock was likely to open around the first target the next day, which it did, and although up to much to chase an entry, that the stock would likely pullback, offering another shot at an entry. A very sharp pullback actually came the very next trading session on Oct 1st, much sooner than expected, which took RIMM all the way back down to re-test the wedge pattern to the cent, thereby offering a golden entry opportunity.
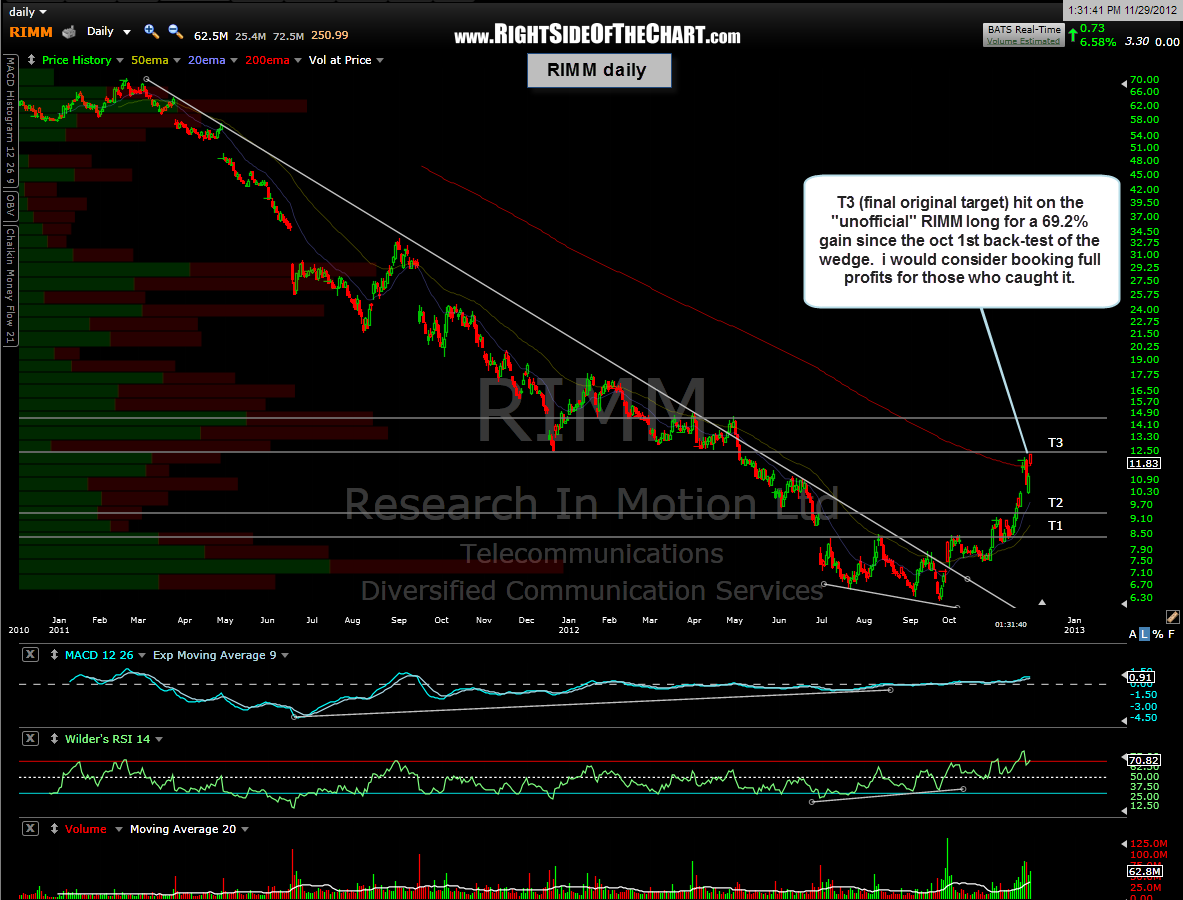
All of the above was detailed in various posts back at the time which can always be referenced by clicking on the blue “RIMM” symbol towards the bottom of the post. I only wanted to point out that T3 (my final target) was hit today for what could have been a 69.2% gain has anyone acted on the charts posted earlier and entered long on that pullback to re-test the pattern on Oct 1st. If so, congratulations and consider booking partial or full profits as this was my final target and I do believe that the R/R no longer favors being long the stock.
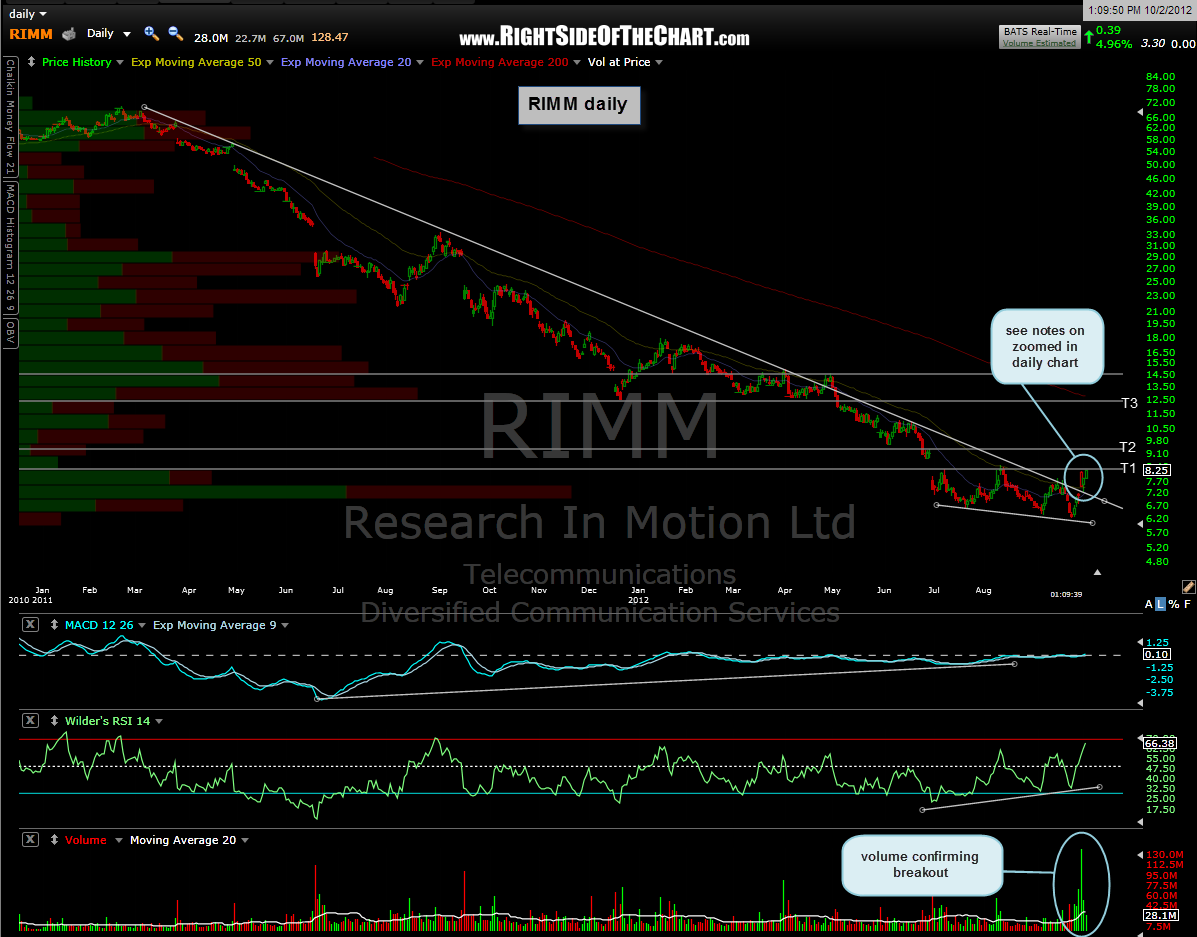
The other take-away from this is that I post a very substantial quantity of trade ideas and although I do my best to closely monitor these setups and active trades, it it very difficult to monitor each and every one continually. To most effective make use of this site, you should replicate the patterns and notes (targets, support & resistance levels) on each setup or active trade idea that you might be interested in or take as a trade. Daily charts in order as posted with the most recent last.