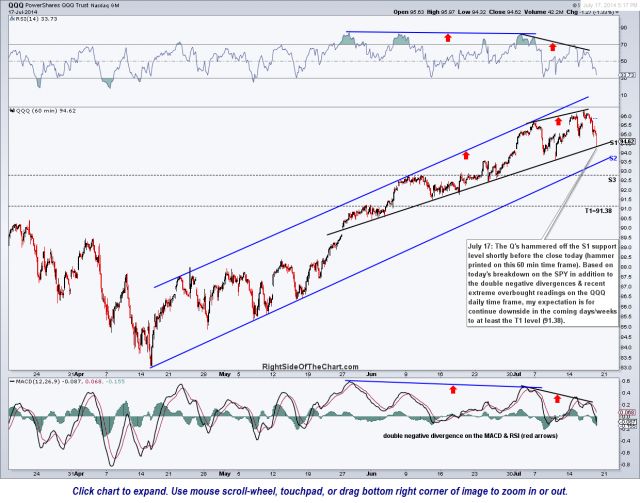
The Q’s hammered off the S1 support level shortly before the close today (hammer was printed on this 60 min time frame, not on the daily frame). If & when the S1 uptrend line is taken out, the next support comes in at the blue R2 uptrend line, where another reaction is likely. However, based on today’s breakdown on the SPY in addition to the double negative divergences (60 minute) & the recent extreme overbought readings on the QQQ daily time frame, my expectation at this time is for continue downside in the coming days/weeks to at least the T1 level (91.38) before any significant bounce and/or resumption of the primary uptrend.
click here to view the live, annotated 60 minute chart of the QQQ (intraday time periods are viewable only by stockcharts.com subscribers)


