When posting market analysis, I will often post two or more key indexes and one of the main reasons for doing so is that it is important not to develop tunnel vision when trading a stock or the “market” (SPY, QQQ, etc..). For example, it is very common during a sell-off, or a rally for that matter, for one of the major indexes to fall just shy or slightly exceed a well defined support or resistance level, only to have that index suddenly reverse once another key index bounces of a key level of it’s own. Therefore, if you only trade the SPY, for example, you would be remiss to focus solely on the $SPX/SPY charts while ignoring some of the other major indexes.
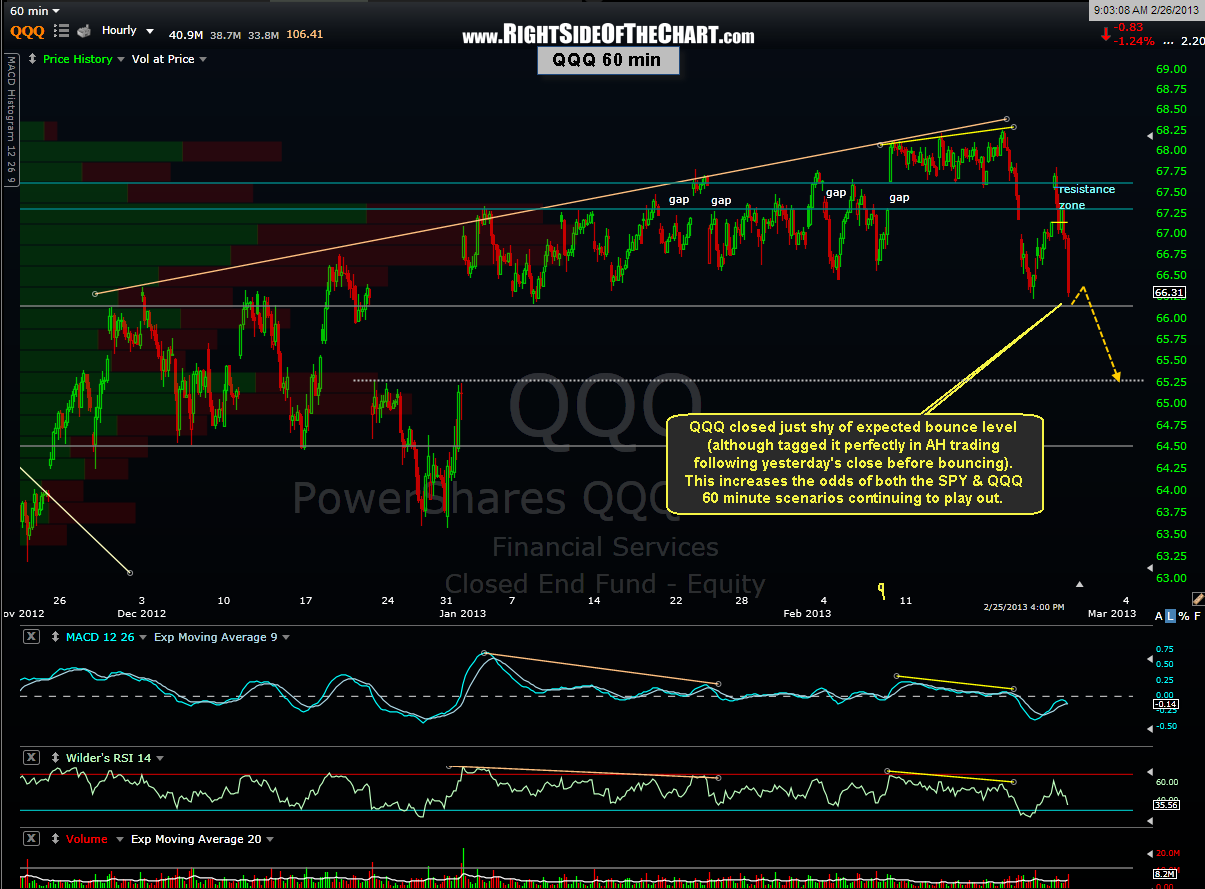
As these updated 60 minute charts of the QQQ & SPY show, the SPY overshot it’s support level, where I was expecting it to find support and put in a bounce, while the QQQ stopped about the same relative distance above it’s expected bounce level (although the Q’s did continue to sell off in after-hours trading immediately following the close and basically hit that level to the penny before bouncing and have continued to move higher since).
If you look at the percentage losses in these two key indices yesterday, you’ll see that the SPY dropped 1.77% against a drop of “only” 1.24% in the QQQ, which pretty much accounts for the fact that the SPY overshot it’s support level while the QQQ fell above an equal amount shy of it’s support. Without keeping an eye on multiple key indices, one might assume that a break of a key support level on the SPY, as we had yesterday, would open the door to additional downside, as support breaks usually do. However, the fact that the QQQ bounced (so far) off support and the SPY has now regained it’s expected bounce support level (in AH trading since the close yesterday), increases the chance that we get that small counter-trend bounce that was outlined on my 60 minute scenarios yesterday.
Another place that I find watching “multiple indices on multiple time frames” extremely useful in trading is determining when to close or hold my open stock positions. I can’t tell you how many times I was fortunate or insightful enough to close a stock trade early before my expected final target because the broad market had hit a key support or resistance level where I was expecting a bounce. The chart on the stock trade may have not been signaling time to close the position but if the broad markets make a sharp pullback at resistance (or bounce off support), there is a good chance that most individual stocks will go with it, regardless of their chart patterns at the time. Keep in mind that this is most useful when a stock trade is getting close to it’s final target, not so much in the early stages of the trade shortly following the entry. Here are the updated 60 min SPY & QQQ charts as of yesterday’s close. My primary scenario remains the same and just an fyi, although the next targets are roughly where I expect prices to go once (if) the downtrend resumes, the bounce targets drawn on these charts is only a rough estimate and points more to the fact that I expect a relatively shallow & short-lived bounce.