
A break below Friday’s low of 108.12 would likely bring QQQ down to any or all of the blue horizontal lines below & quite possibly beyond. 60-minute chart:
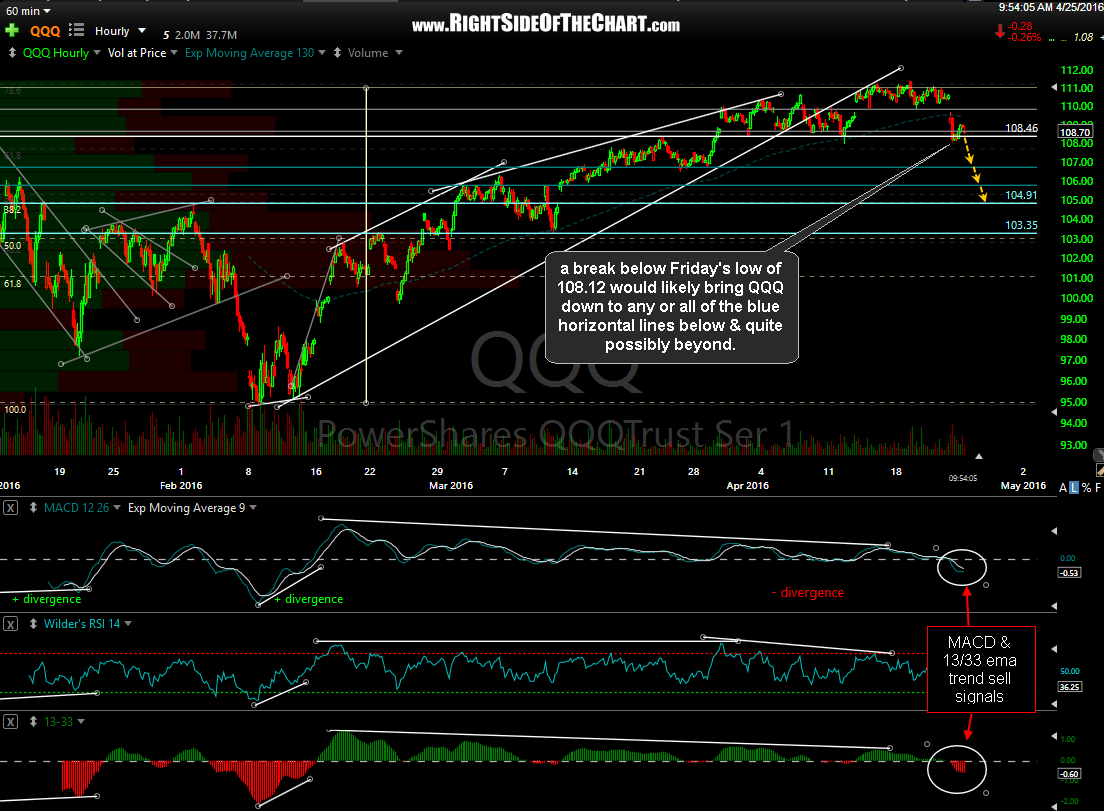
QQQ 60-minute April 25th
SPY still appears somewhat more healthy from a technical perspective than QQQ although both appear headed lower in the coming days to weeks. A break below the 207 level + price channel will likely spark a move to any of all of the potential targets/key support levels down to the 197 area. 120-minute chart:
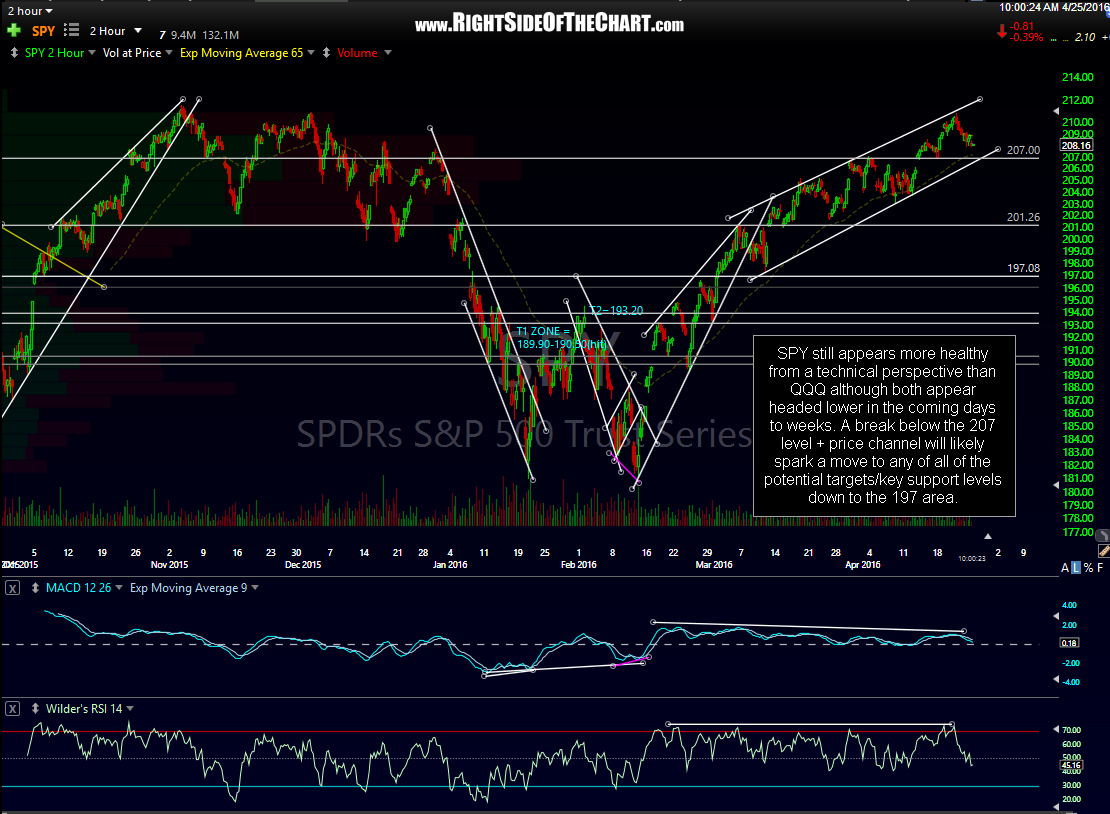
SPY 120-minute April 25th