
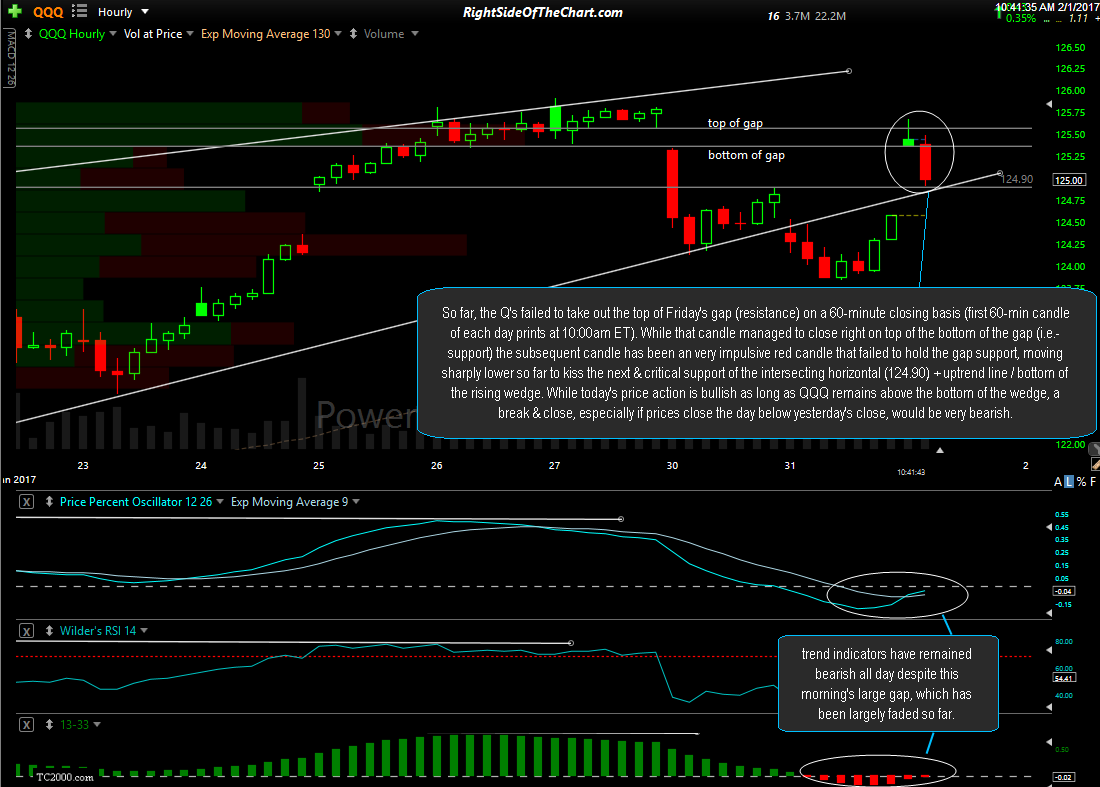
So far, the Q’s failed to take out the top of Friday’s gap (resistance) on a 60-minute closing basis (the first 60-min candle of each day prints at 10:00am ET so it represents only 30-minutes of trading). While that candle managed to close right on top of the bottom of the gap (i.e.- support) the subsequent candle has been an very impulsive red candle that failed to hold the gap support, moving sharply lower so far to kiss the next & critical support of the intersecting horizontal (124.90) + uptrend line / bottom of the rising wedge. As I put a higher weighting into price action vs. the trend indicators, today’s price action is bullish as long as QQQ remains above the bottom of the wedge. However, a break below the wedge, especially if prices close the day below yesterday’s close, would be very bearish.
QQQ 60-min 2 Feb 1st
While QQQ has already faded 2/3rds of today’s gap, it is worth noting that the SPY has already faded all of today’s gap & then some, taking it from a nice gap to going red on the day so far with IWM nearly fading all of its gap as well so far. The 60-minute trend indicators on both SPY & QQQ have also remained on sell signals throughout the day, despite the large opening gaps. Those trend indicators are the PPO and/or MACD signal line (9-ema) and the 13/33-ema histogram, both indicating that the trend is bullish when above their respective zero-lines, bearish when below.