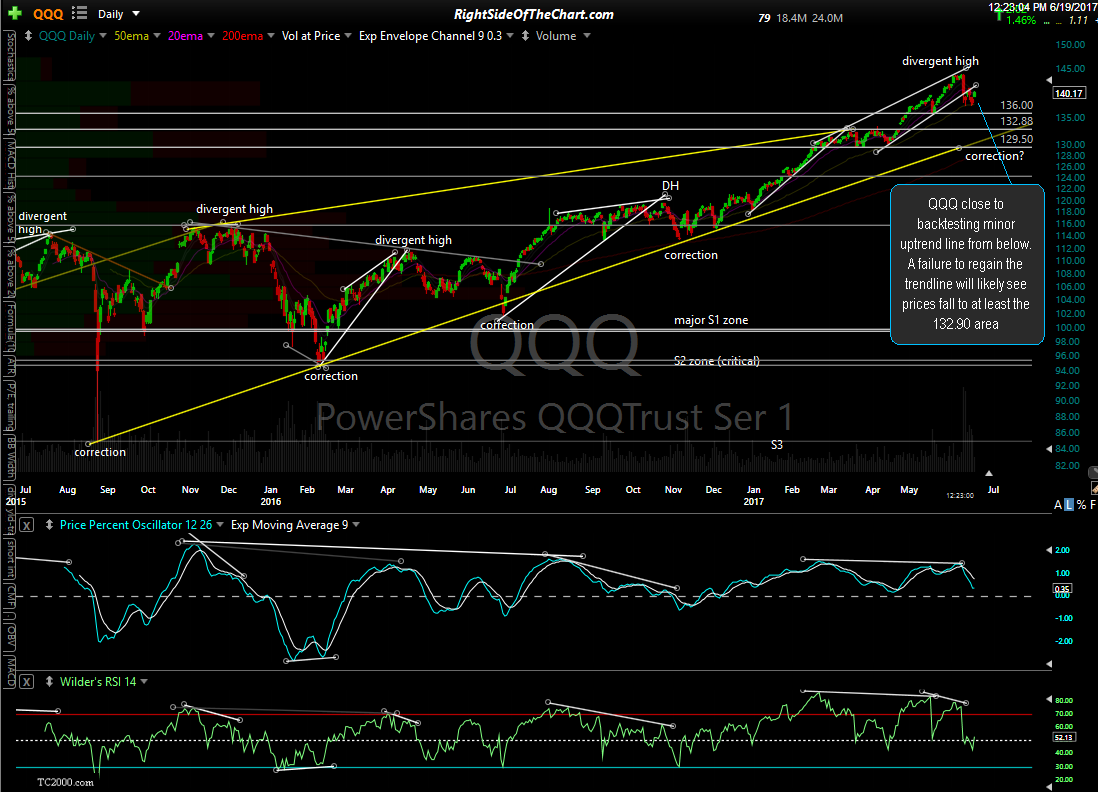
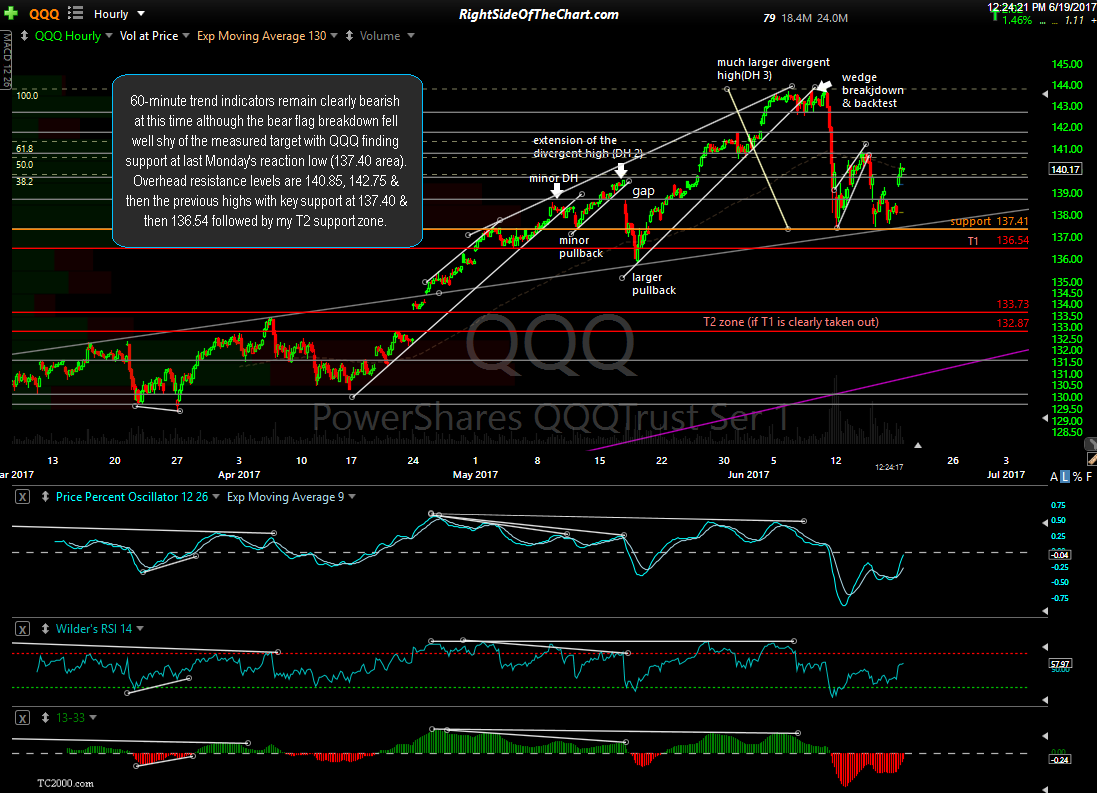
On the daily time frame, QQQ is close to backtesting minor uptrend line from below. A failure to regain the trendline will likely see prices fall to at least the 132.90 area. 60-minute trend indicators remain clearly bearish at this time although the bear flag breakdown fell well shy of the measured target with QQQ finding support at last Monday’s reaction low (137.40 area). Overhead resistance levels are 140.85, 142.75 & then the previous highs with key support at 137.40 & then 136.54 followed by my T2 support zone.
-

- QQQ daily June 19th
-

- QQQ 60-min June 19th
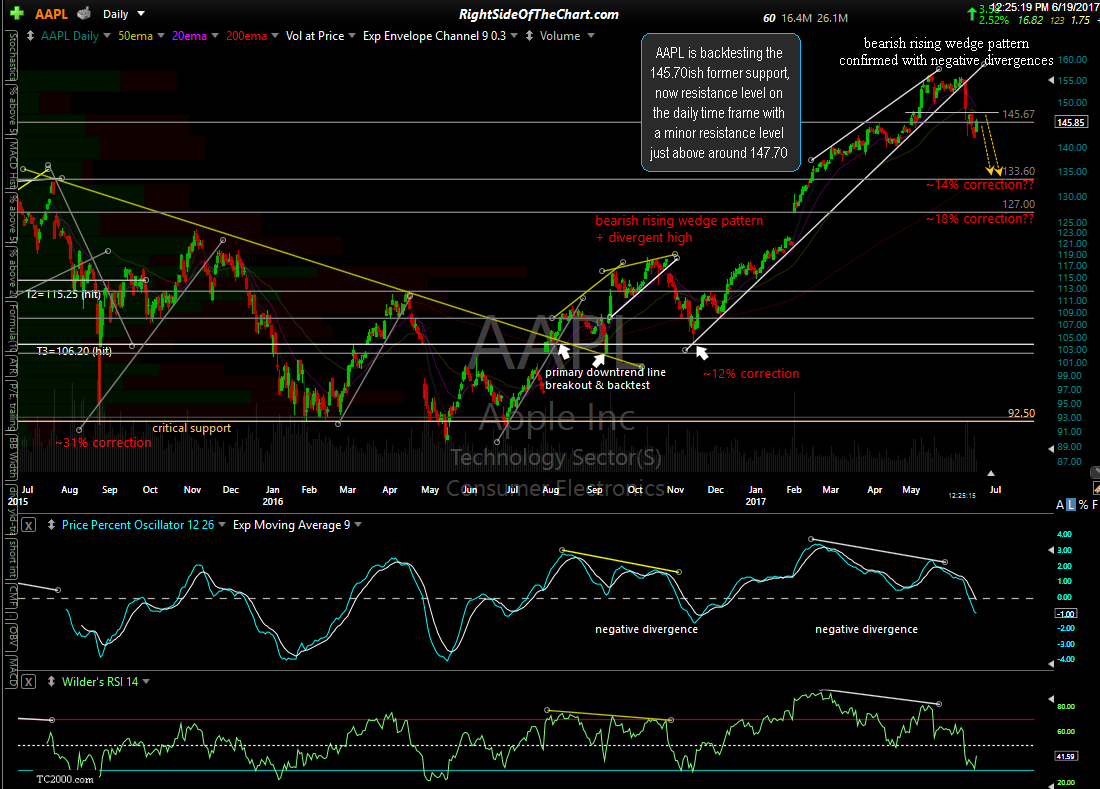
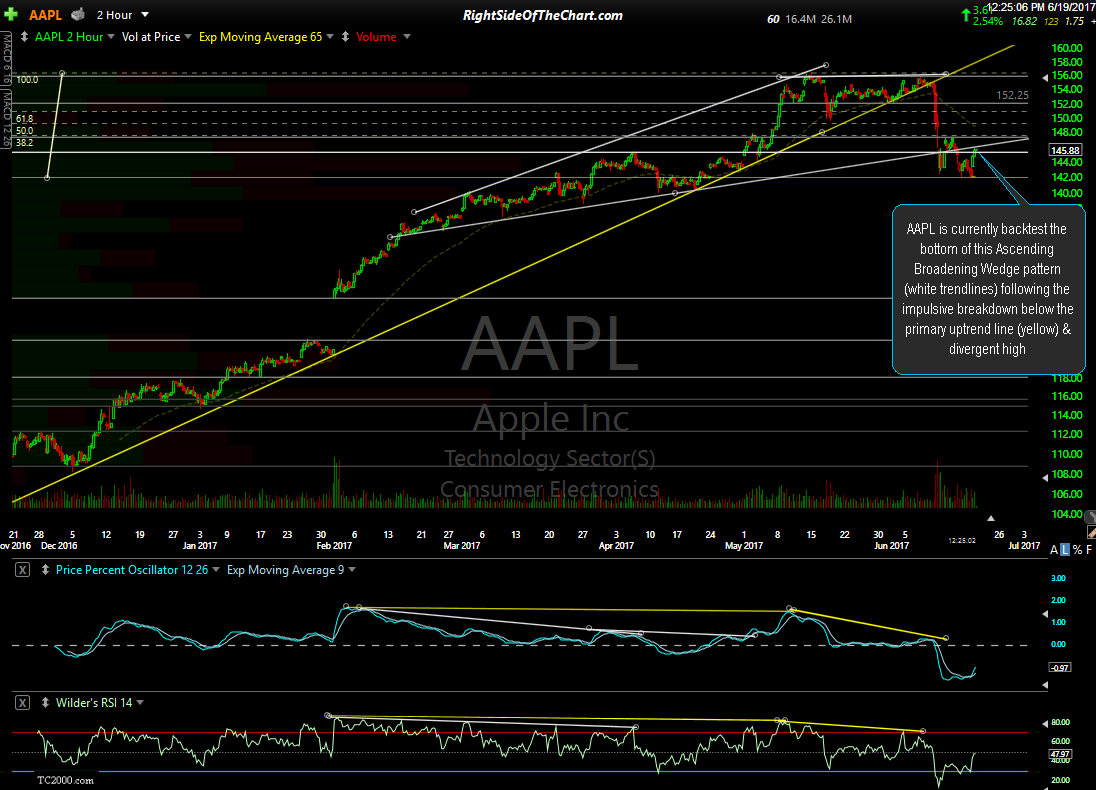
AAPL is backtesting the 145.70ish former support, now resistance level on the daily time frame with a minor resistance level just above around 147.70 while on the 120-minute time frame, the stock is currently backtest the bottom of this Ascending Broadening Wedge pattern (white trendlines) following the impulsive breakdown below the primary uptrend line (yellow) & divergent high.
-

- AAPL daily June 19th
-

- AAPL 120-minute June 19th
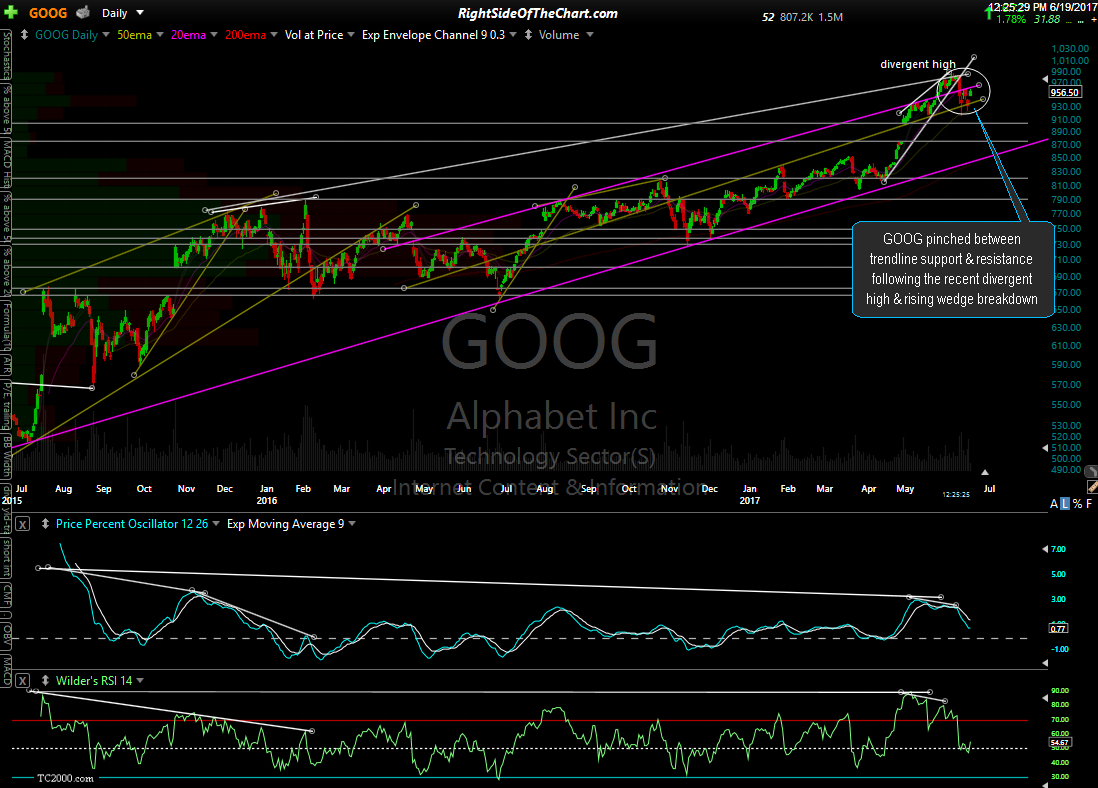
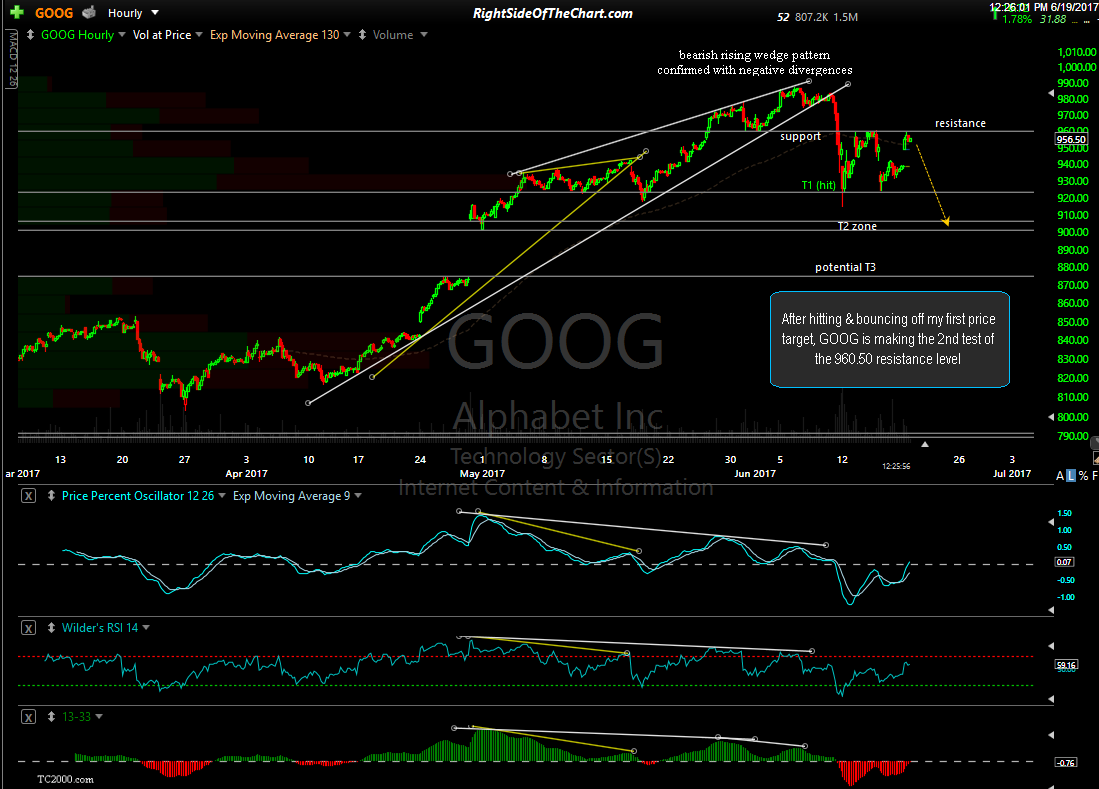
On the daily chart, GOOG is pinched between trendline support & resistance following the recent divergent high & rising wedge breakdown. Zooming down to the 60-minute time frame, after hitting & bouncing off my first price target, GOOG is making the 2nd test of the 960.50 resistance level.
-
- GOOG daily June 19th
-
- GOOG 60-minute June 19th
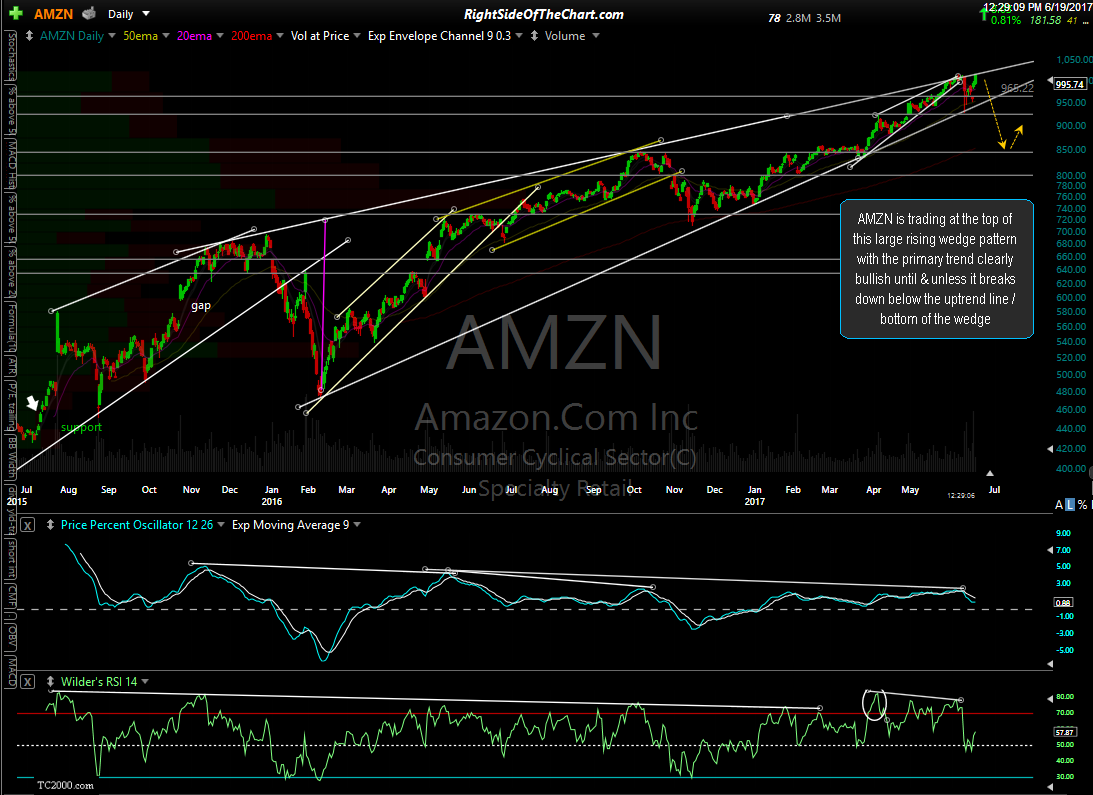
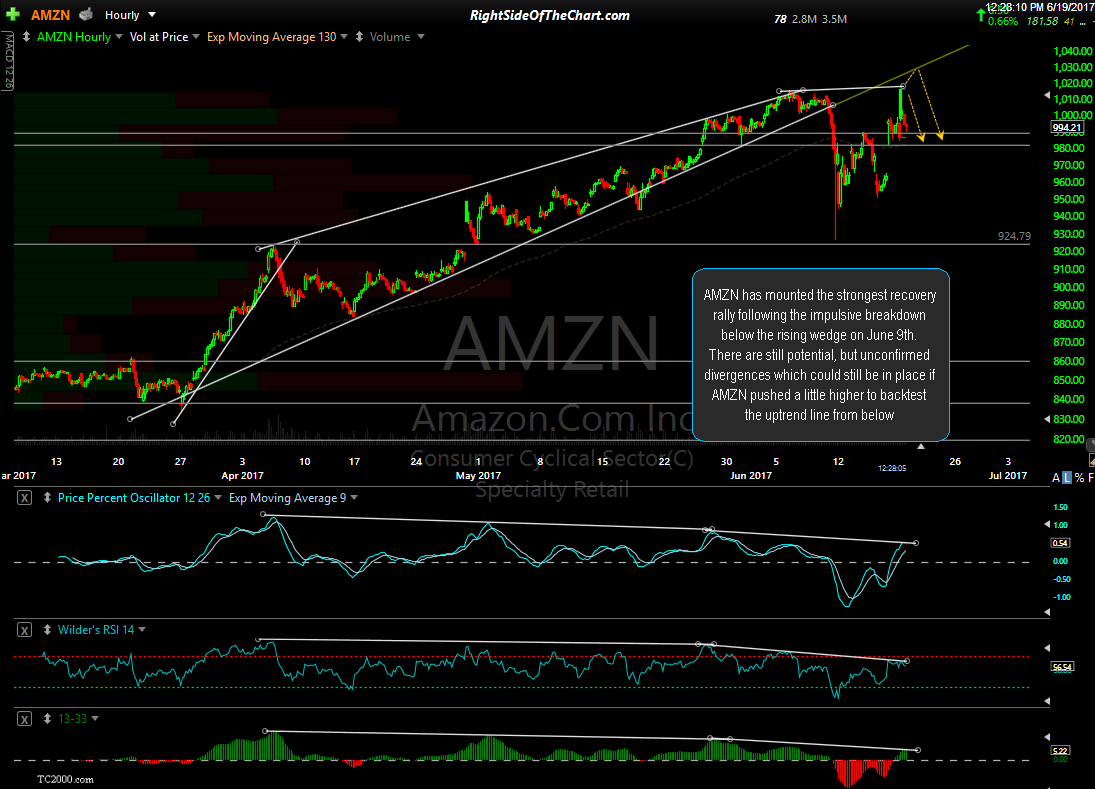
AMZN is trading at the top of this large rising wedge pattern on the daily time frame with the primary trend clearly bullish until & unless it breaks down below the uptrend line / bottom of the wedge. Looking at the 60-minute chart, AMZN has mounted the strongest recovery rally following the impulsive breakdown below the rising wedge on June 9th. There are still potential, but unconfirmed divergences which could still be in place if AMZN pushed a little higher to backtest the uptrend line from below.
-

- AMZN daily June 19th
-
- AMZN 60-minute June 19th
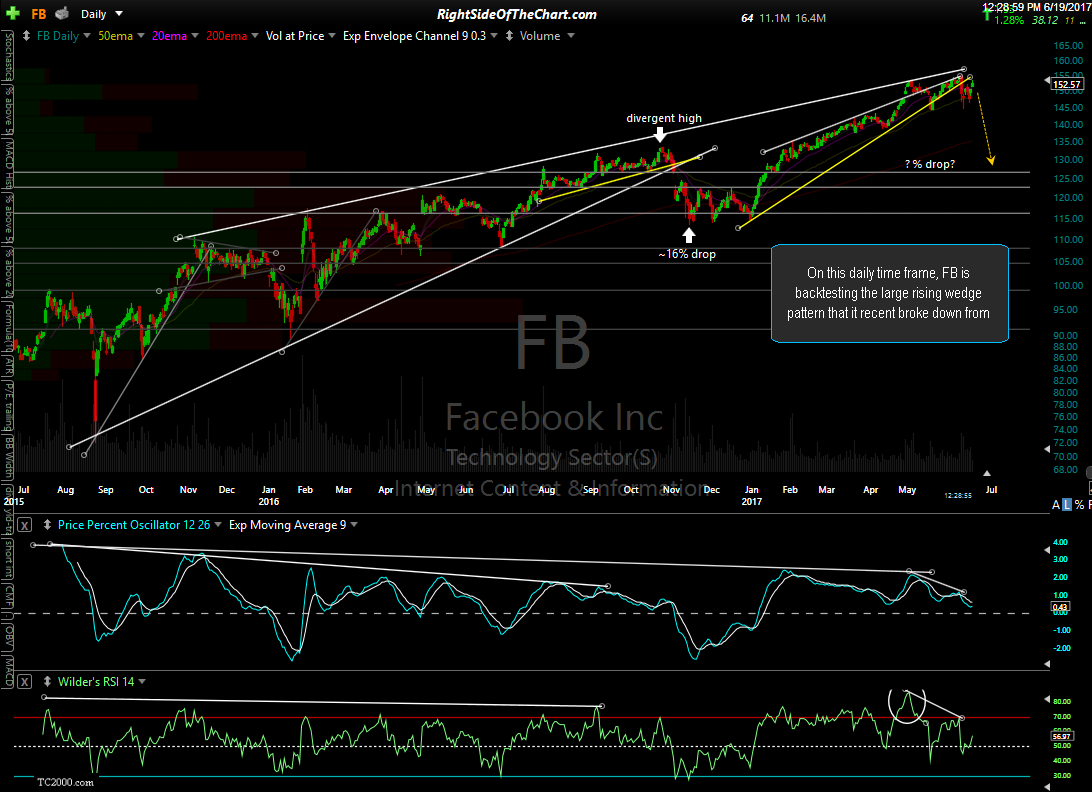
On this daily time frame, FB is backtesting the large rising wedge pattern that it recent broke down from with the stock mounting a decent rally so far following the wedge breakdown on the 60-minute chart. The previous highs are resistance with key support around 144.45.
-

- FB daily June 19th
-

- FB 60-minute June 19th

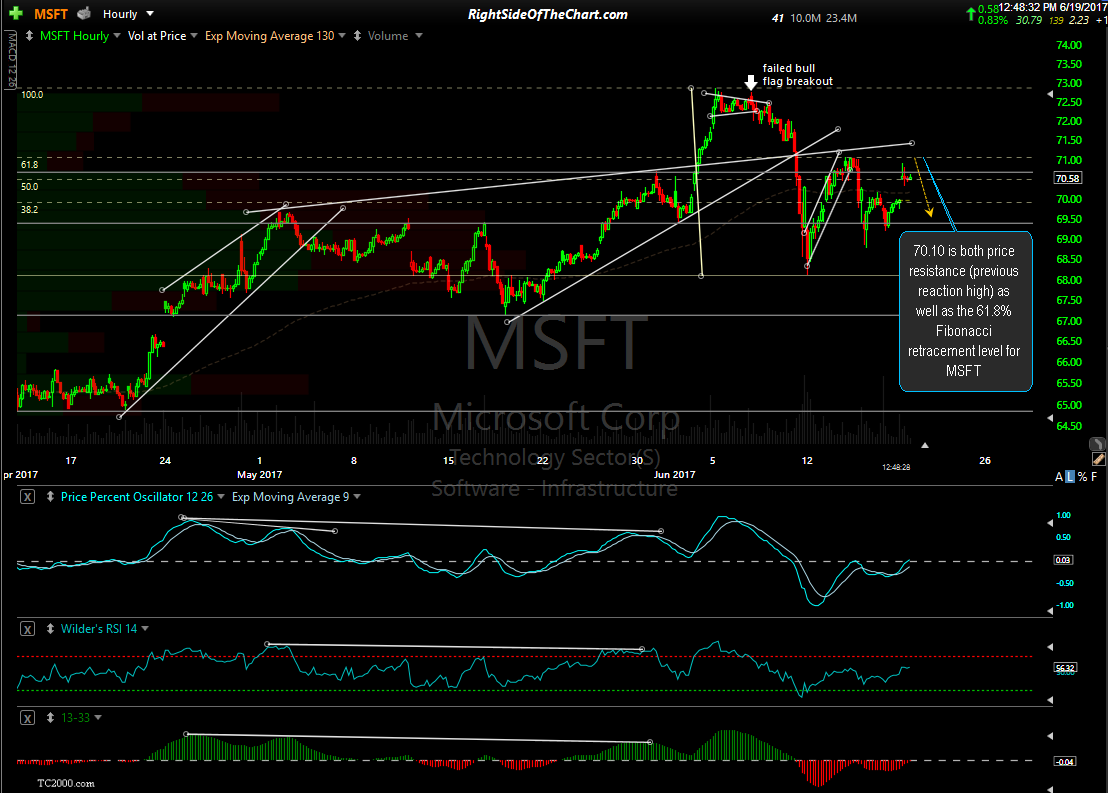
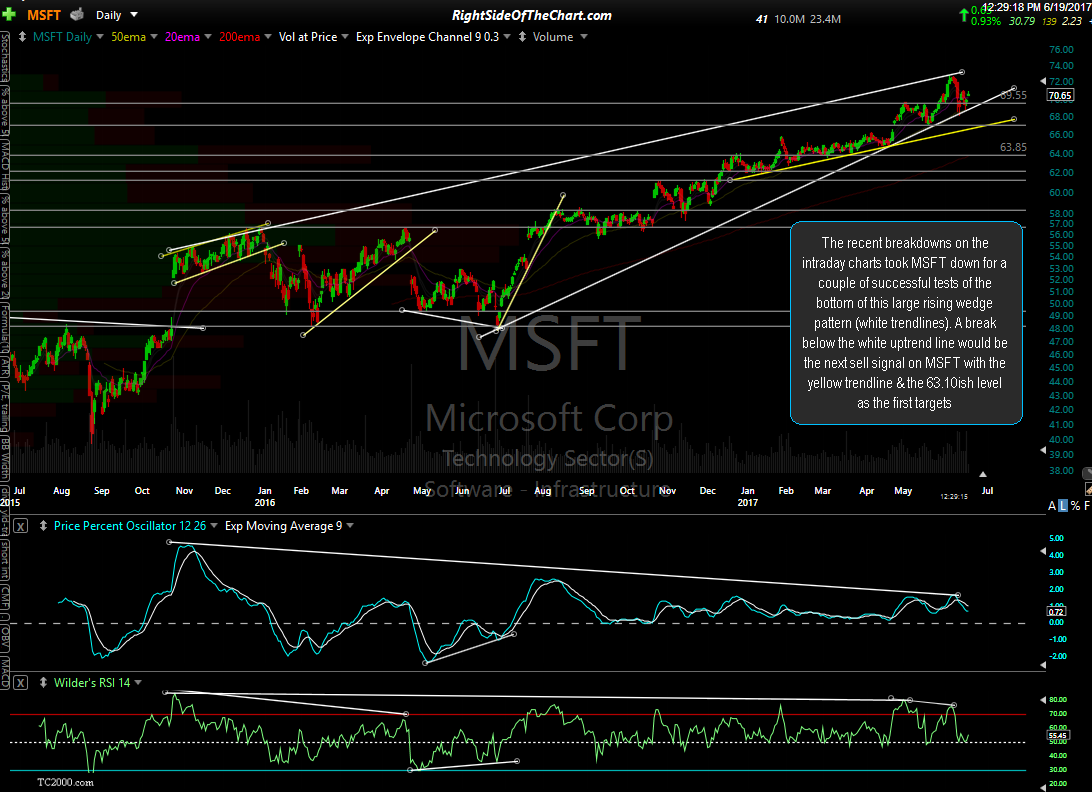
The recent breakdowns on the intraday charts took MSFT down for a couple of successful tests of the bottom of this large rising wedge pattern (white trendlines). A break below the white uptrend line would be the next sell signal on MSFT with the yellow trendline & the 63.10ish level as the first targets. Looking the 60-minute chart, 70.10 is both price resistance (previous reaction high) as well as the 61.8% Fibonacci retracement level for MSFT.
-
- MSFT daily June 19th
-

- MSFT 60-minute June 19th