
The first chart below is a 2-year daily chart of QQQ which highlights all of the corrections in recent years. Each of the 5 corrections shown on this chart (the first one starting to the left of the chart, out of view) have a few things in common:
- They were all preceded by a divergent high (negative divergence on the PPO, MACD & RSI)
- the PPO (and MACD) 9-ema crossed below the zero line, confirming the near-term trend had changed from bullish to bearish
- All (but this one, so far) ended with the RSI at or below oversold (30 or below) readings
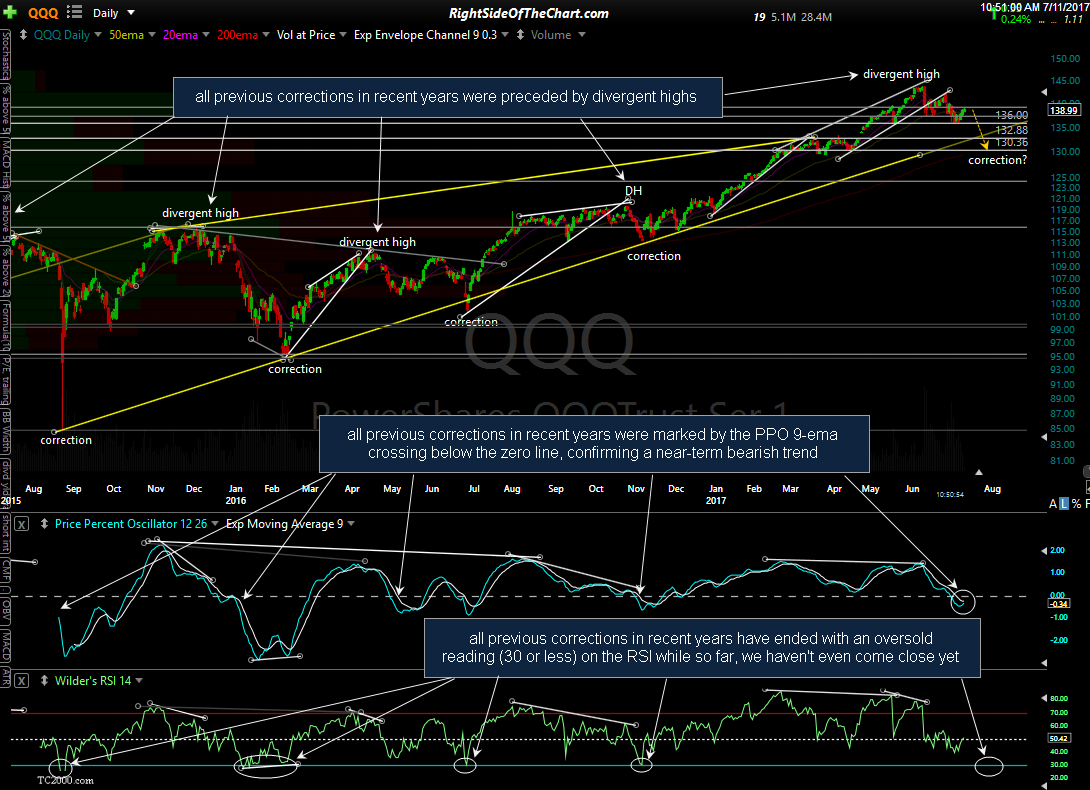
QQQ daily July 11th
I don’t see anything in the charts that would indicate that this time will be different (more downside until the daily RSI reaches oversold readings), with the recent trendline breakdown, bearish engulfing candlestick and other high probability sell signals that have occurred in the Nasdaq 100 & market leading FAAMG stocks over the last 5 weeks or so. One early indication that the recent pullback may have run its course would be a cross & daily close of the PPO 9-ema back above the zero line although that trend indicator is prone to the occasional whipsaw signal. A more significant bullish development that would open the door to new highs would be a move & daily close back above the 141.00 resistance level on QQQ, although I believe that is quite unlikely at this time.
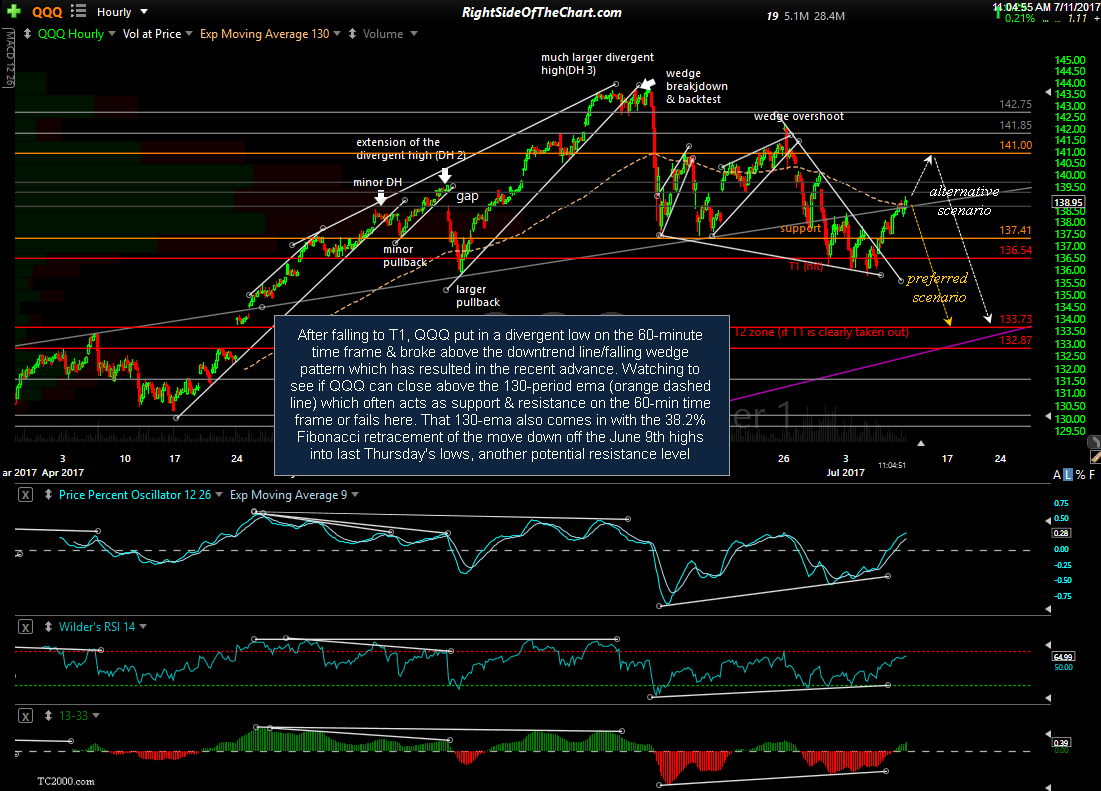
QQQ 60-minute July 11th
Zooming down to the 60-minute time frame (above), the positive divergences that were highlighted last week have come into play in recent sessions. After falling to T1 (first target), QQQ put in a divergent low on the 60-minute time frame & broke above the downtrend line/falling wedge pattern which has resulted in the recent advance. Watching to see if QQQ can close above the 130-period ema (orange dashed line) which often acts as support & resistance on the 60-min time frame or fails here. That 130-ema also comes in with the 38.2% Fibonacci retracement of the move down off the June 9th highs into last Thursday’s lows, another potential resistance level. My primary scenario, which has QQQ reversing around current levels, followed by a resumption of the downtrend, is shown in orange with my alternative scenario, a continued advance up towards the aforementioned 141.00 resistance level before a resumption of the downtrend, shown in white.