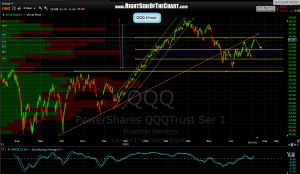
 i noticed that the last 4 hour period chart of the QQQ that i posted on tuesday had a slight drift on the uptrend line. trend line drift, or the slight shifting of a trendline, is occasionally an issue with the TC2000 charting program. not a big deal since my resistance zone for the Q’s is a compilation of that fib cluster (the two 61.8% retracement lines at 64.77 & 65.25) as well as that yellow horizontal resistance line at 65.17. the fact that the uptrend line comes in just north of that resistance cluster only adds to the validity of that level. either way, here’s the updated 4 hour chart with the corrected uptrend line.

