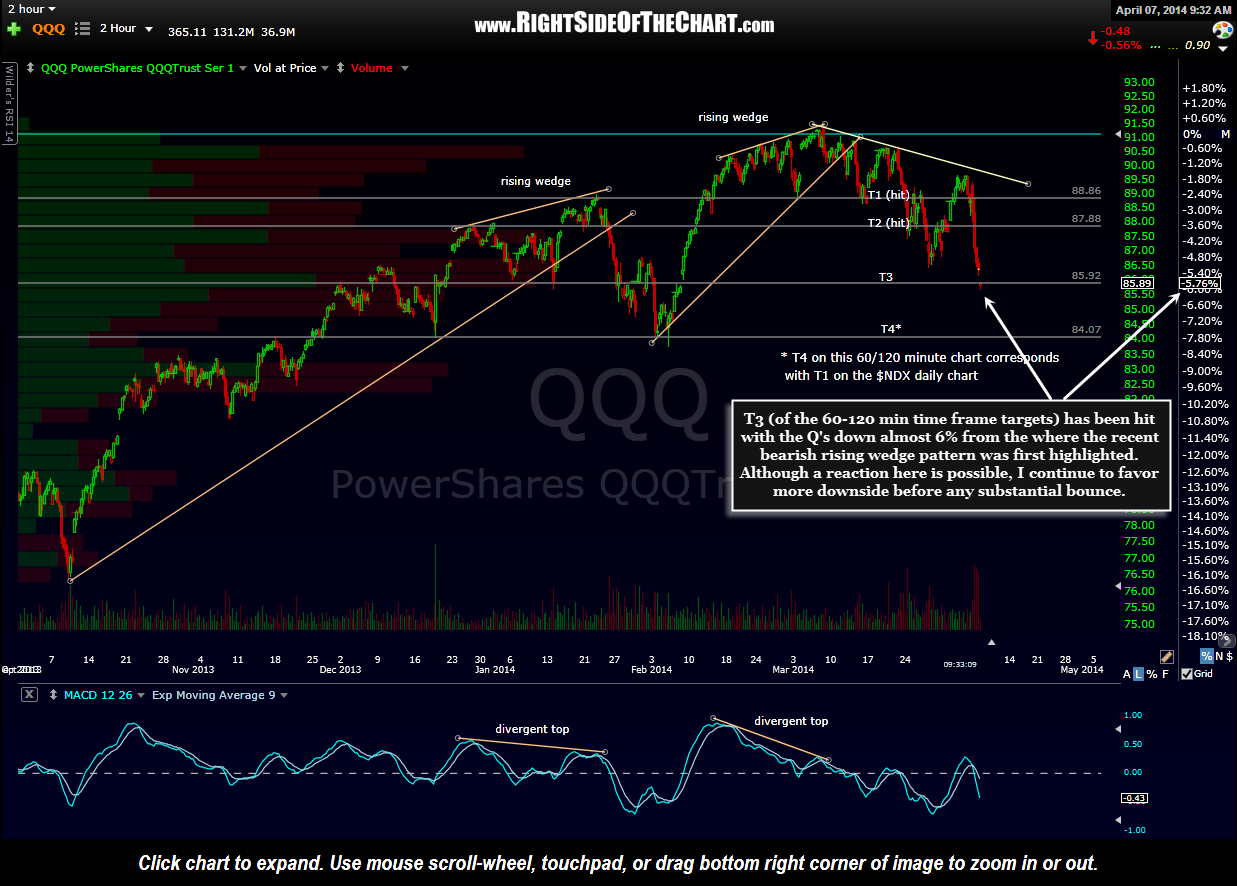
The third near-term target (of the 60-120 min time frame targets) on the QQQ has been hit with the Q’s down almost 6% from the where the recent bearish rising wedge pattern was first highlighted. Although a reaction (pause or bounce) here is likely, I continue to favor more downside before any substantial (3%+) move higher. At this point, with the short-term trend bearish for exactly one month now (the QQQ/$NDX topped on March 7th) and the intermeditate-term trend moving closer to bearish territory, to I start to turn my focus more on the daily charts in order to help determine the most likely path for the markets going forward. Doing so helps to determine which profit target(s) to use in closing out my short trades. Although things can change quickly in the markets, at this time I believe that any rallies are likely to be relatively minor in scope and duration and a move down to the T4 level on the 120 minute chart (which is also T1 on the $NDX daily chart) in the coming days is likely. With that being said, the markets are getting oversold on the short-term time frames and with both the Q’s & SPY at support (the SPY is back to the top of my 60-120 min T1 zone), in general I am not interested in adding any more short exposure with the exception possibly being a very attractive short trade bouncing back to a solid resistance level or some other very compelling, high R/R entry.
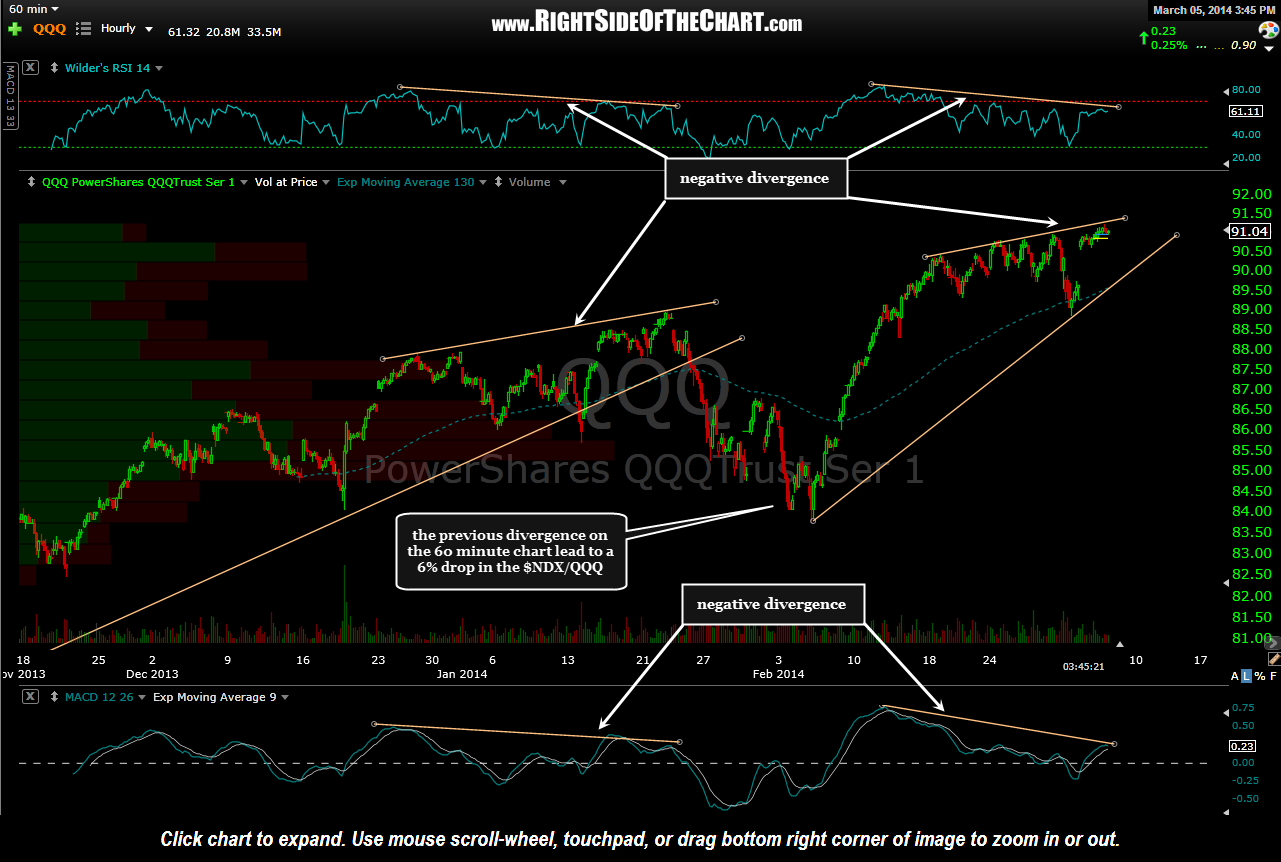
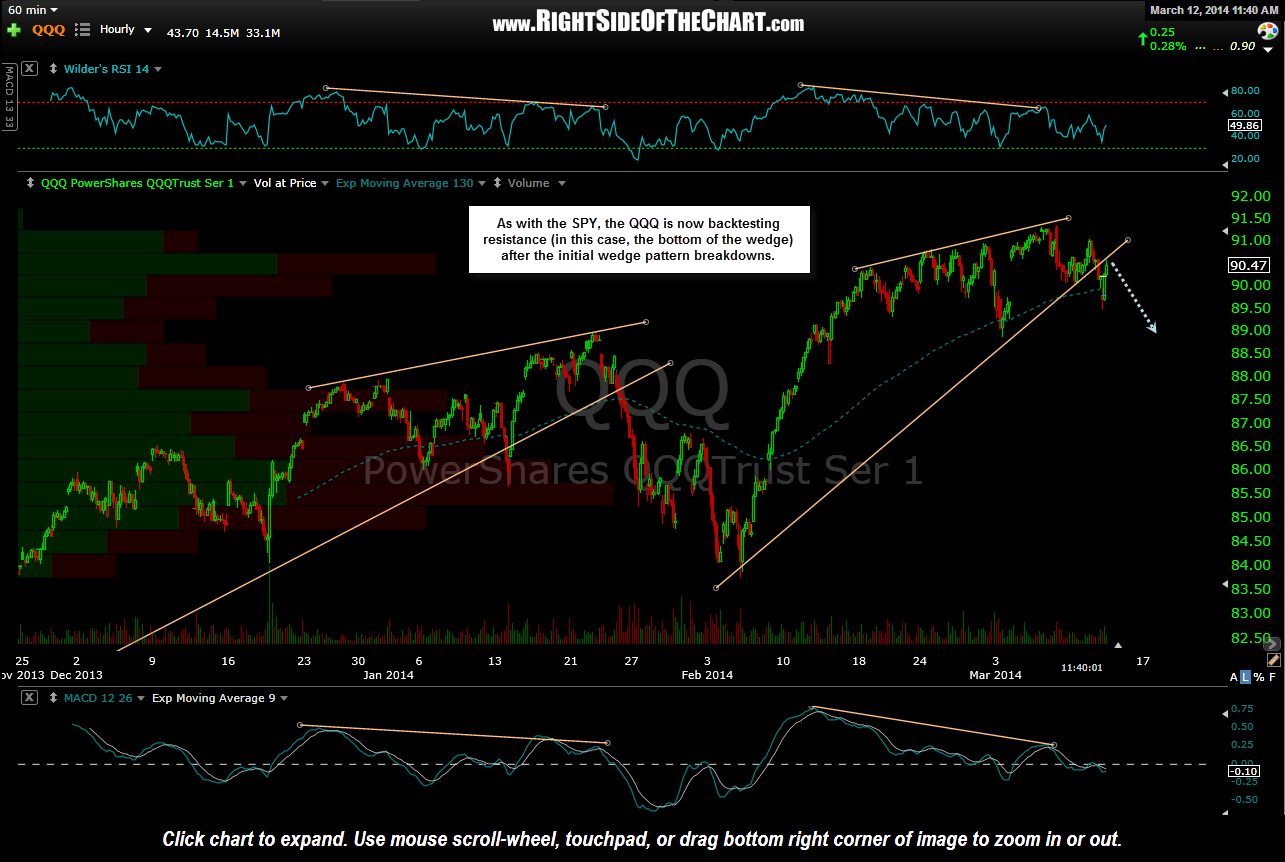
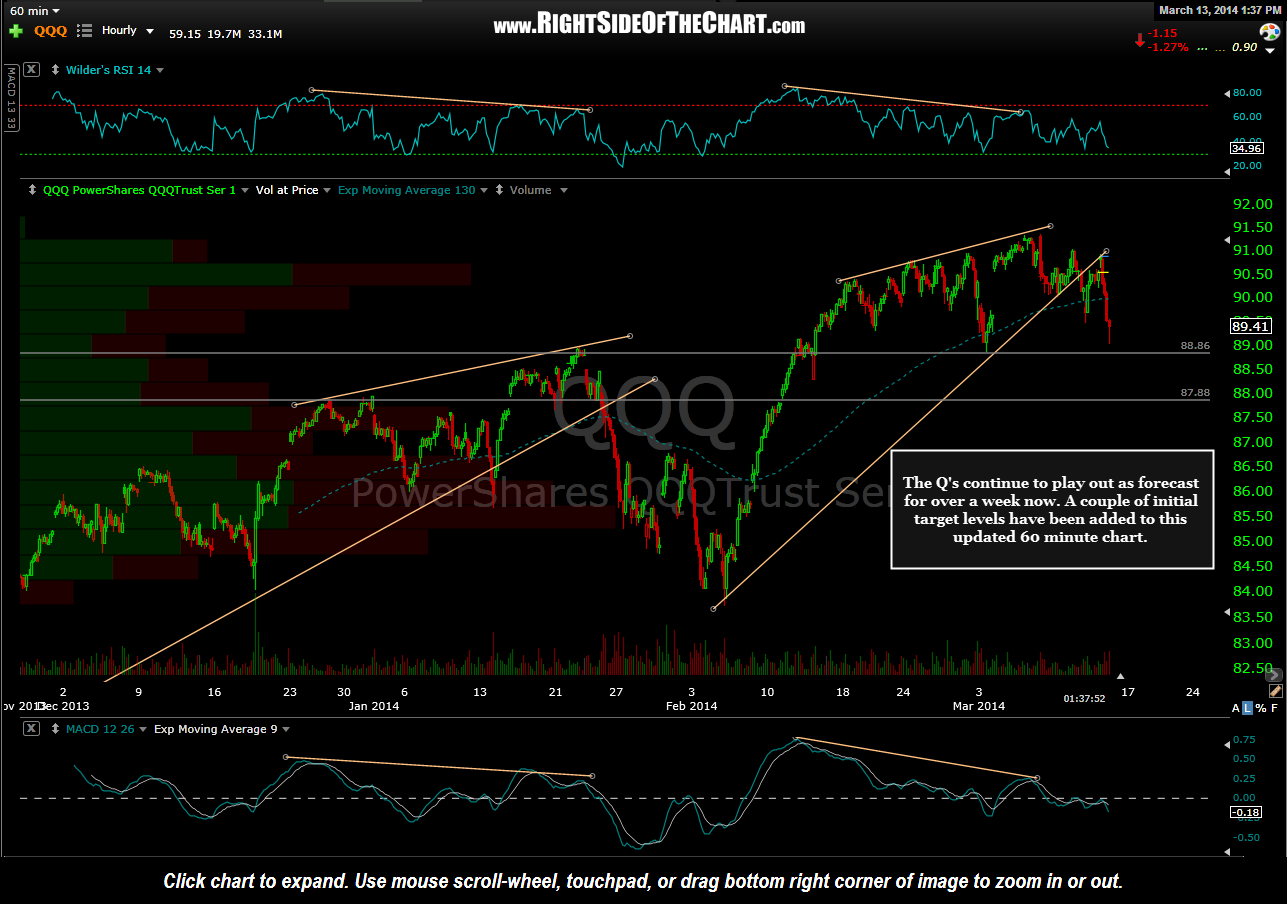
The charts below are the most recent string of the 60 & 120 minute QQQ charts. This move down so far has been nearly textbook with the first 60 minute chart posted back on March 5th highlighting the QQQ at the top of the most recent bearish rising wedge pattern. From there, prices went on to make one final tag & bounce off the bottom of the wedge, breaking down below the wedge shortly thereafter, followed by a near-perfect backtest from below and the Q’s continuing to fall from there while making a series of lower highs & lower lows (i.e.- a downtrend).
-

- QQQ 60 min March 5th
-
- QQQ 60 min March 7th

-
- QQQ 60 minute March 12th
-
- QQQ 60 minute March 13th
-
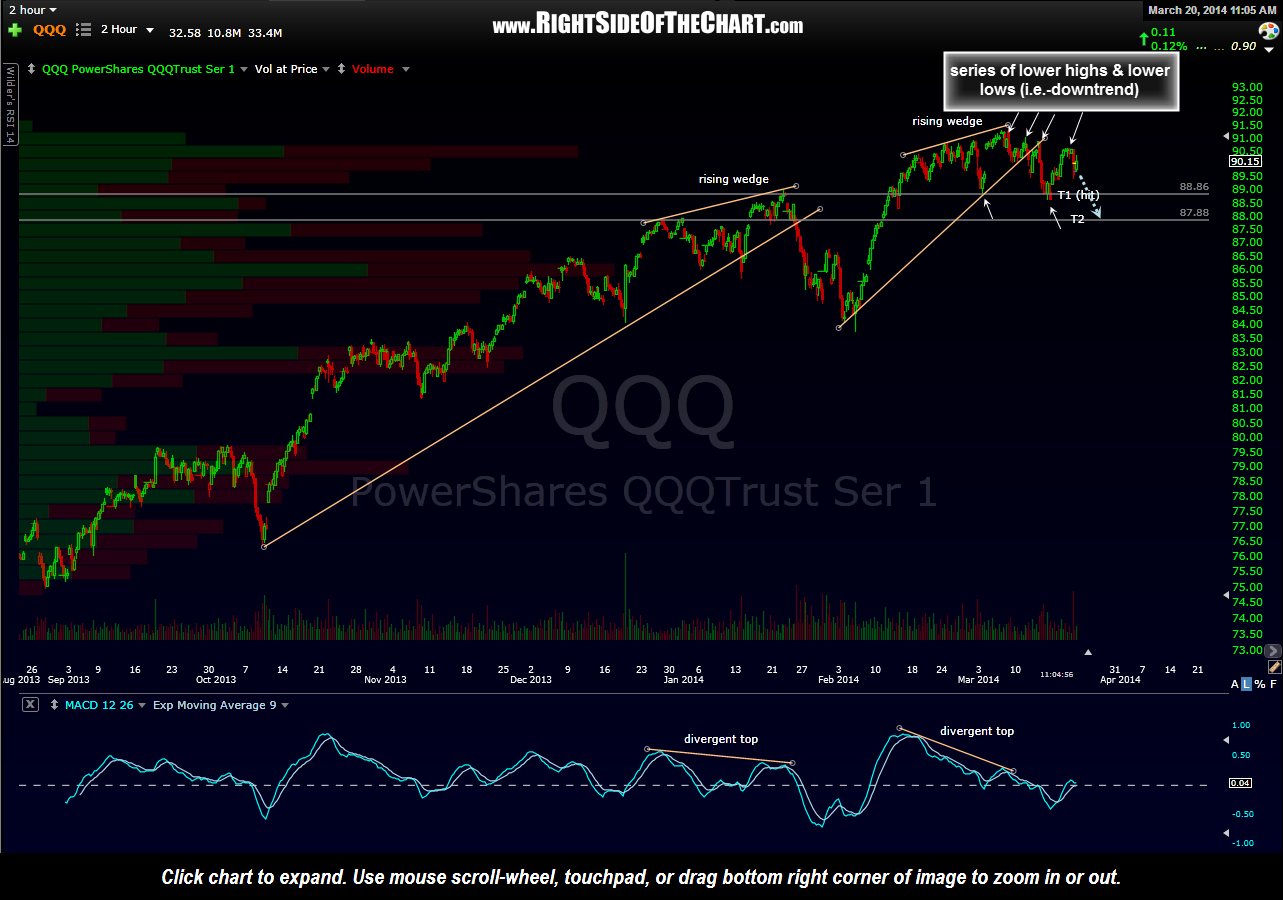
- QQQ 120 minute March 20th
-
- QQQ 120 minute March 24th

-
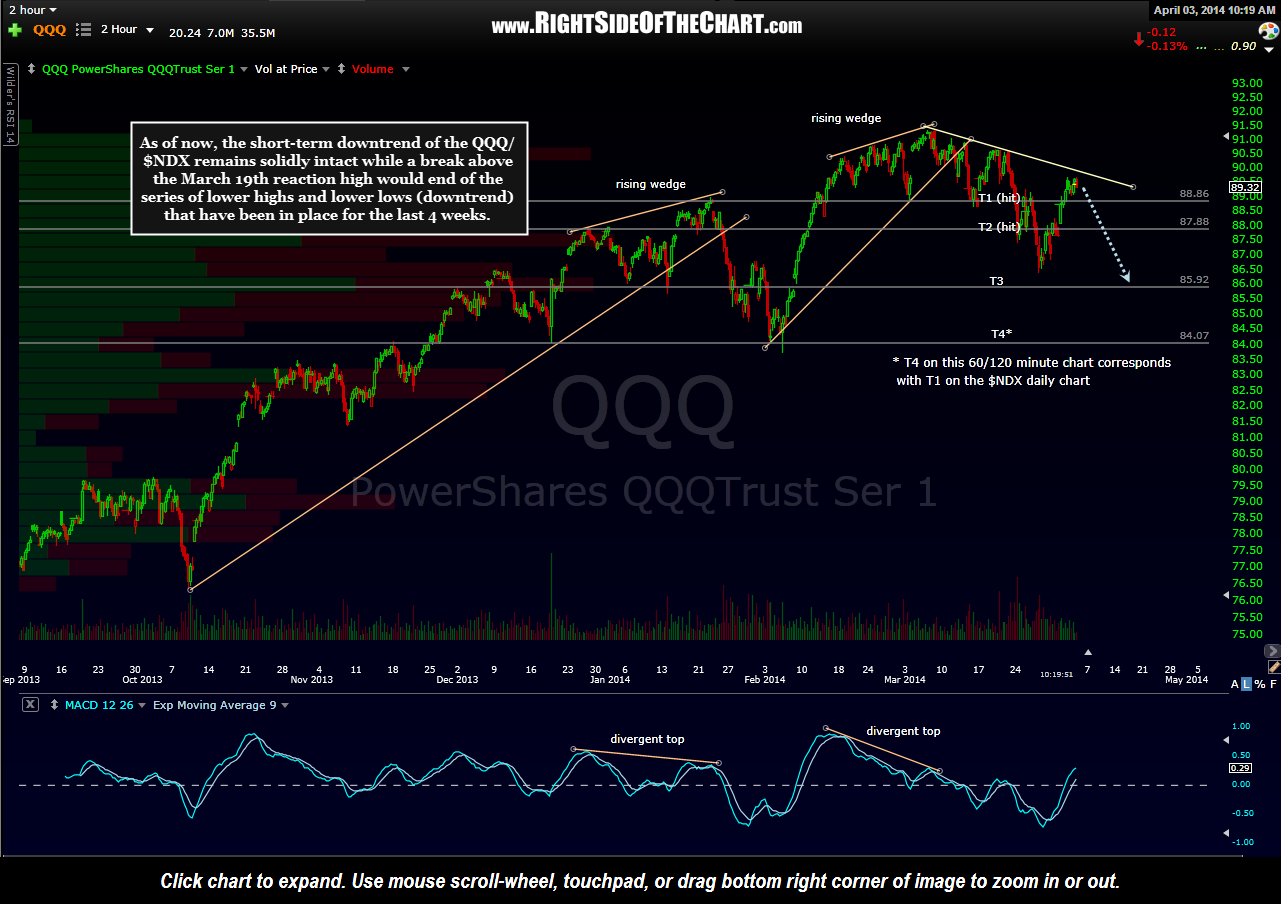
- QQQ 120 minute April 3rd
-
- QQQ 120 minute April 7th