
QEP was one of several long-side trade ideas mentioned on Jan 13th. The horizontal resistance levels on this daily chart are possible longer-term swing targets, should oil prices reverse trend soon. However, the official near-term bounce target is currently the 22.50-22.85 resistance zone (see 2-hour chart).
-

- QEP 120 minute Jan 22nd

-
- QEP daily Jan 22nd
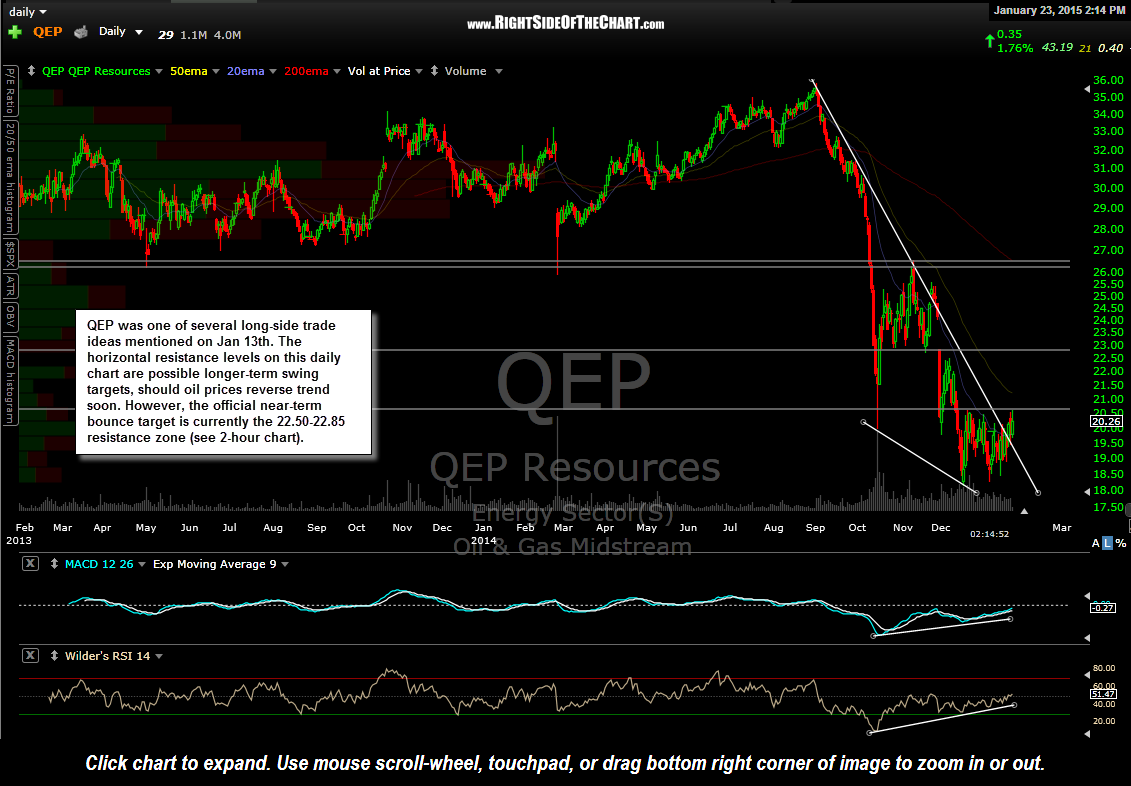
QEP has been consolidating between the 20.50 & 18.30ish range. A break above the top of the trading range will likely propel QEP towards the resistance zone at 22.50-22.85, about 11-13% above current levels. Also note that QEP recently broke above a downtrend line/bullish falling wedge pattern although the breakout has yet to be confirmed with above average volume (breakouts accompanied by at least 1.5x the average trading volume are much more likely to stick). Of course, until/unless oil starts moving higher, I wouldn’t expect any of the current energy stock trade ideas to go very far. With that being said, the similarities between QEP’s recent trading range & the trading range recently pointed out on the USO 60-minute chart are not coincide and the ultimate resolution (up or down) from these ranges are likely to mirror each other although I do believe that trading select energy stocks with the most bullish patterns offers much larger profit potential (percentage-wise).
Although this trade idea was first mentioned 10-days ago, I have yet to list an official price target although I will most likely place the suggested bounce target just below the bottom of the 22.50-22.85 resistance zone.