
Minor squiggles aside, this is my preferred scenario for the Nasdaq 100 over the next several months. Ultimately, a break of the 3850-3900 critical support zone is likely but I’ll have to assess the charts if/when we begin to approach that level to decide whether or not to extend my downside targets.
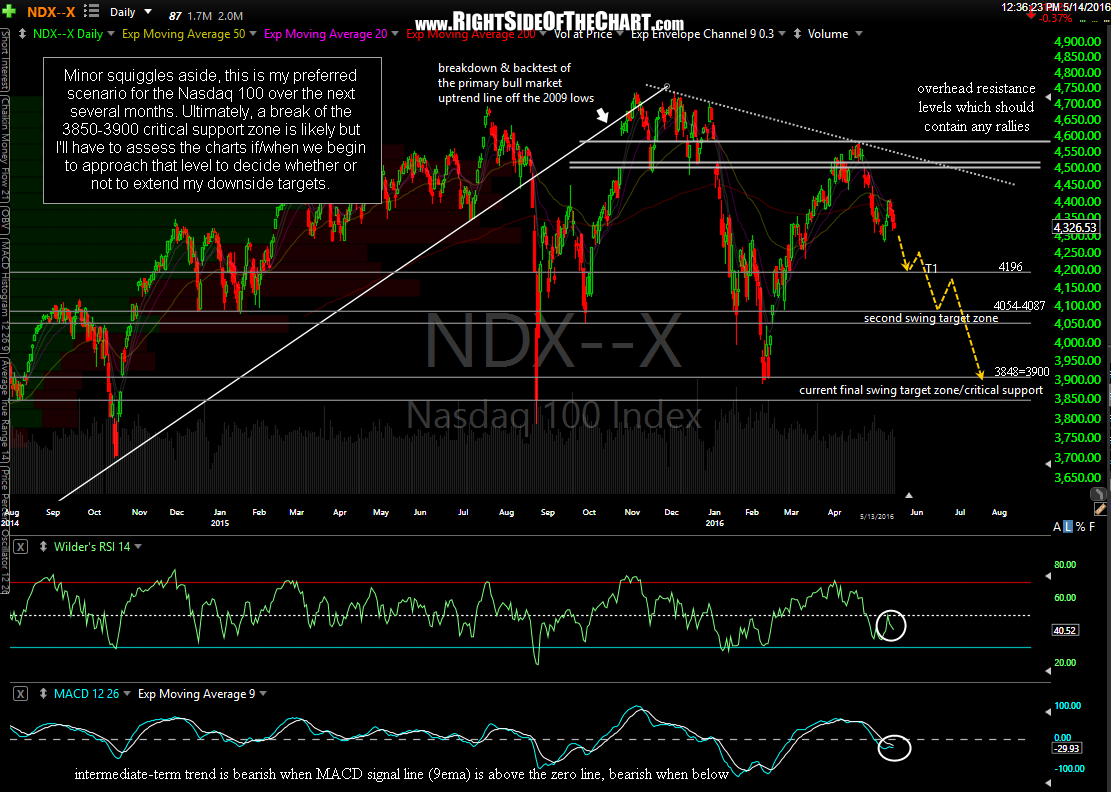
$NDX daily May 14th
Minor squiggles aside, this is my expectation for the S&P 500 in the coming months. I will have to reassess the charts as/If/when we approach that swing target at the 1865-1870 support zone to determine whether or not to extend my downside targets.
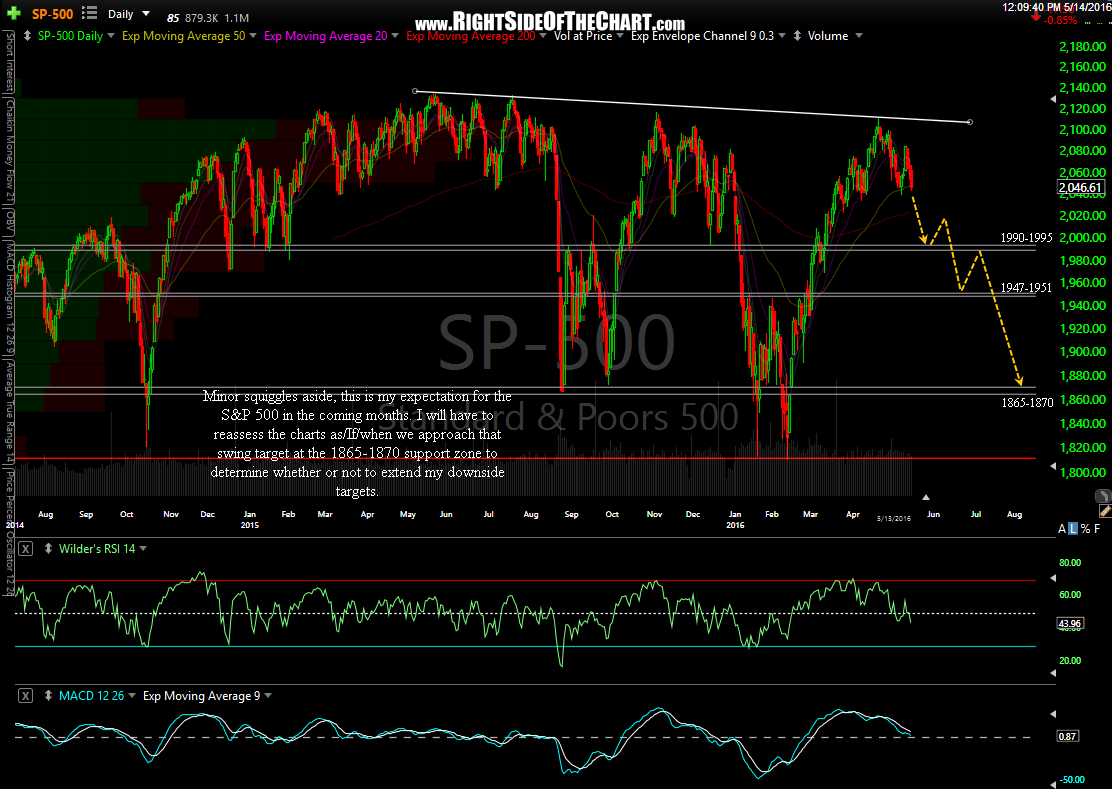
$SPX daily May 14th
It appears that the Russell 2000 small cap index is headed down to the 984-997 support zone in the coming months with likely reactions along the way around the 1065 & 1038 support levels.
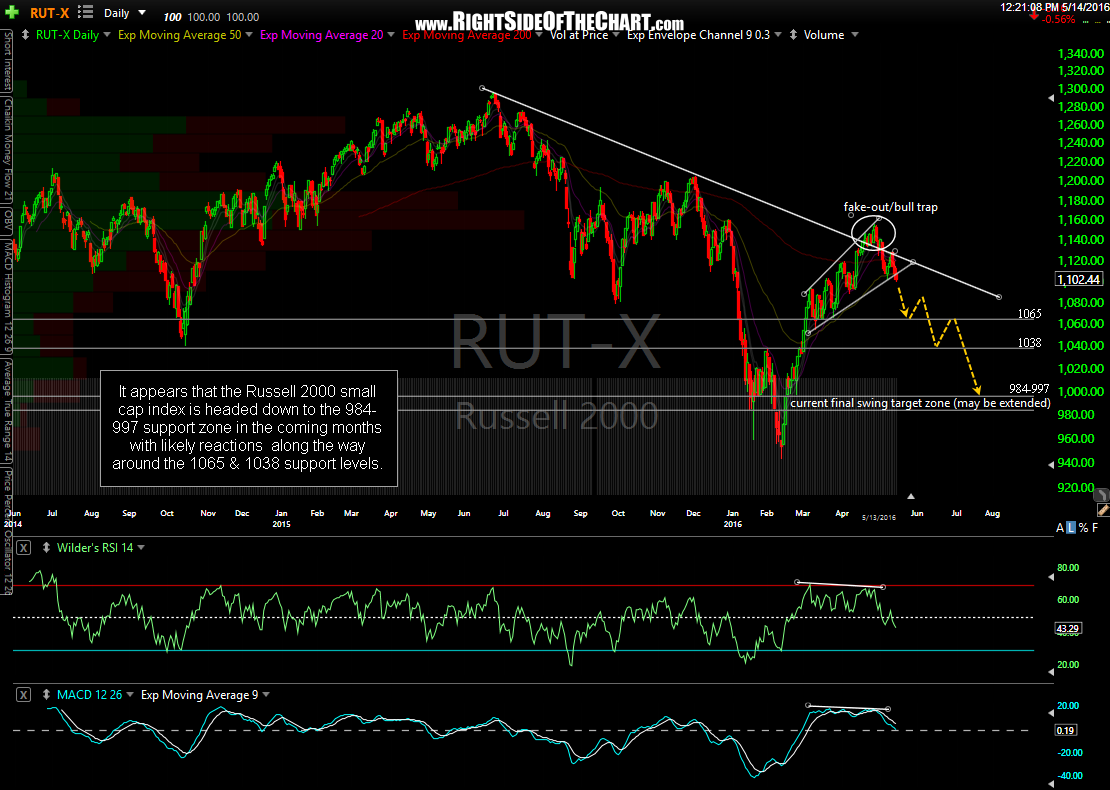
$RUT daily May 14th
Bottom line: The near-term price action support the longer-term bearish case that I’ve been highlighting for months now. Technical evidence continues to build that the rally off the February lows was simply a counter-trend rally within the early stages of a new primary downtrend. I’ve listed a few important resistance zones which should contain any additional upside in the Nasdaq 100 as a break above any & especially all three of those levels (4520, 4575 & the downtrend line off the 12/2/15 reaction high) would rapidly begin to erode the longer-term bearish case for the US equity markets.