The longer that I trade & invest, the more it seems like I’m watching the same movie played over & over every few years. It’s the never ending cycle of booms & busts and if I were to categorize the genre of movies that I’m watching, I’d have to lean more towards labeling them as comedies vs. dramas. The comedic part is the infallible repetitive nature of the general public, the mainstream media and, of course, the part played by the puppeteers pulling the strings.
Funny to see how bearish the most recent headlines are AFTER crude has plunged nearly 60% in just over 6 months. Where was all that talk of a massive glut in crude production back then? If one just stops reading the headlines and focuses on the charts, they might come to the same conclusion that I have that a bottom in crude is much closer than both the media and the puppeteers (hedge funds/institutions that are talking oil down right now while most likely taking the other side of the trade… think GS betting against their clients at the peak of the housing bubble).
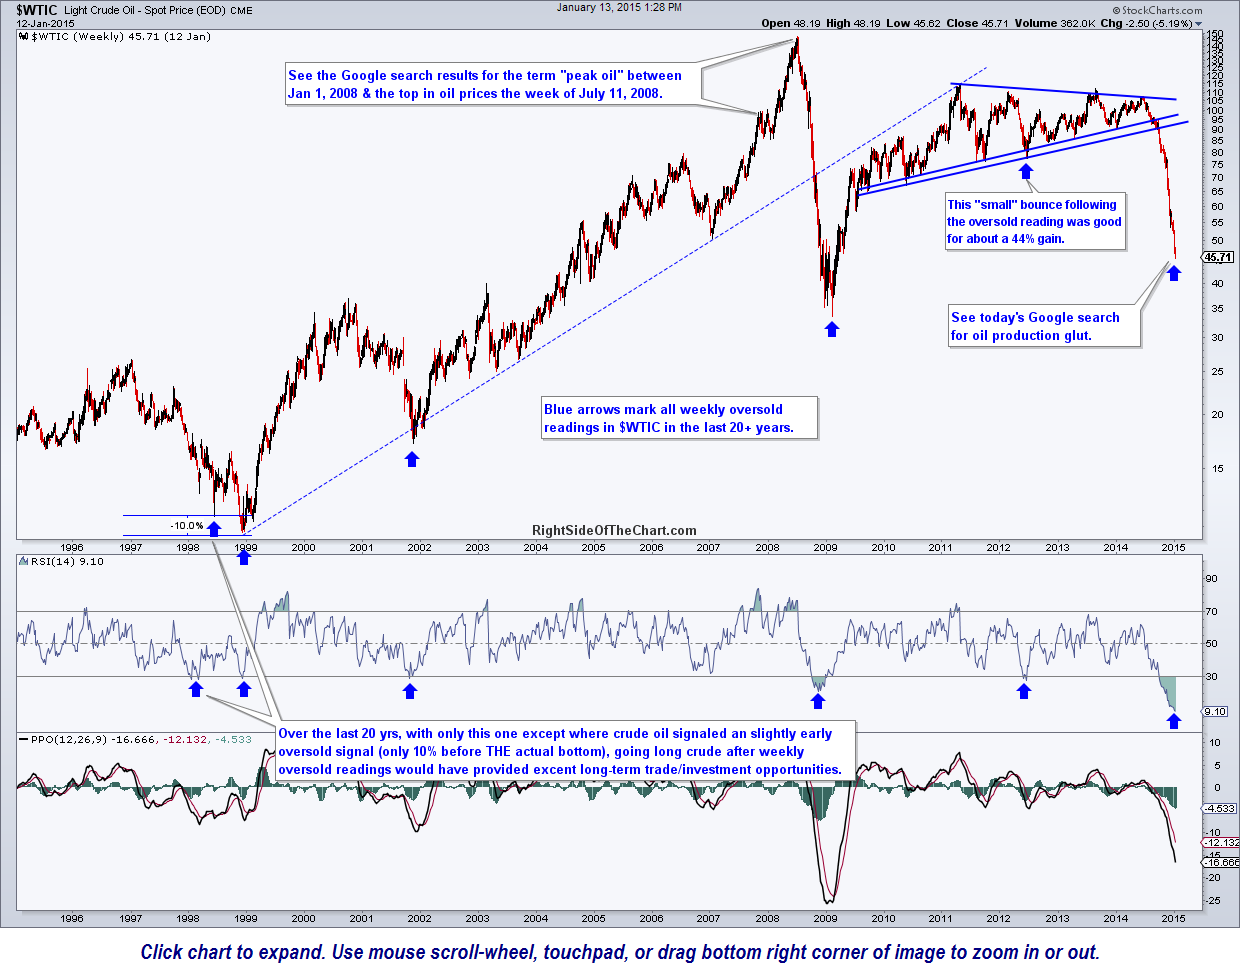
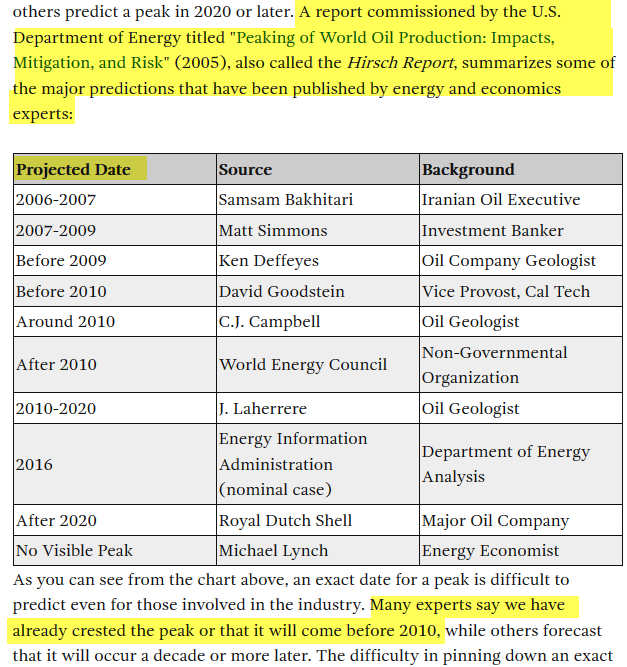
I’ve highlighted two developments on this 20-year weekly chart of $WTIC, the first being a specific technical event (weekly oversold readings on the RSI 14) and the other relating to fundamentals (under-supply & over-supply). As a full-time trader back in 2007 & 2008, I clearly remember the almost manic cries about peak oil. Hardly a day went by without reading or hearing about how the reality of peak oil was rapidly closing in on the world. Once oil crossed the $100/bbl in early 2008 the chatter only intensified and by the time oil reached nearly $150/bbl a few months later, even the guy that cuts my grass was talking about how $10/gallon gas was right around the corner. Click here to view on article published by Investopedia back in 2008 which concludes with the following statement: Even conservative estimates predict a peak in years, not centuries. The question now is what will we do to be ready for it?
We all know what happened from there and even with the roughly 75% plunge in oil prices that immediately followed the July 2008 peak in crude oil prices, crude didn’t even come close to reaching such oversold extremes as it now has (although the “supply glut” chatter seems to be about on par with the “peak oil” chatter back then as best I can recall). With that being said, I’ve started combing thru the charts looking for some long-side trade ideas on energy related stocks, some as both potential bounce (oversold) trades as well as longer-term bottoming plays, in which I plan to use a scale-in strategy. Some of the candidates that I found so far that fit both categories (poised for a potential bounce and possibly a longer-term trade) are: RIG, SLB, CAM, DO, QEP, NOV & SFY. I will follow-up with some charts including entry & exit (targets/stops) levels asap, on some of these as well as any other attractive candidates in the sector that I come across but I just wanted to throw out a few names at this time for those who might want to start adding some exposure to the energy sector (other than trading crude oil directly).
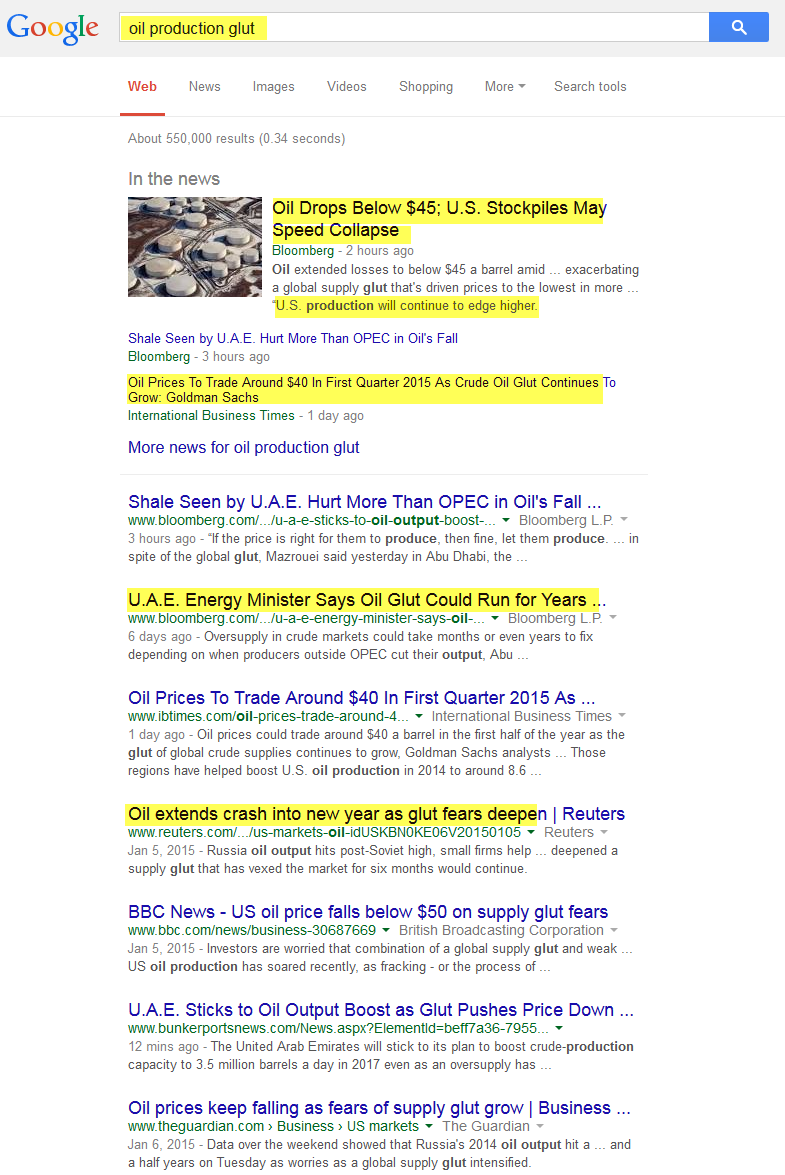
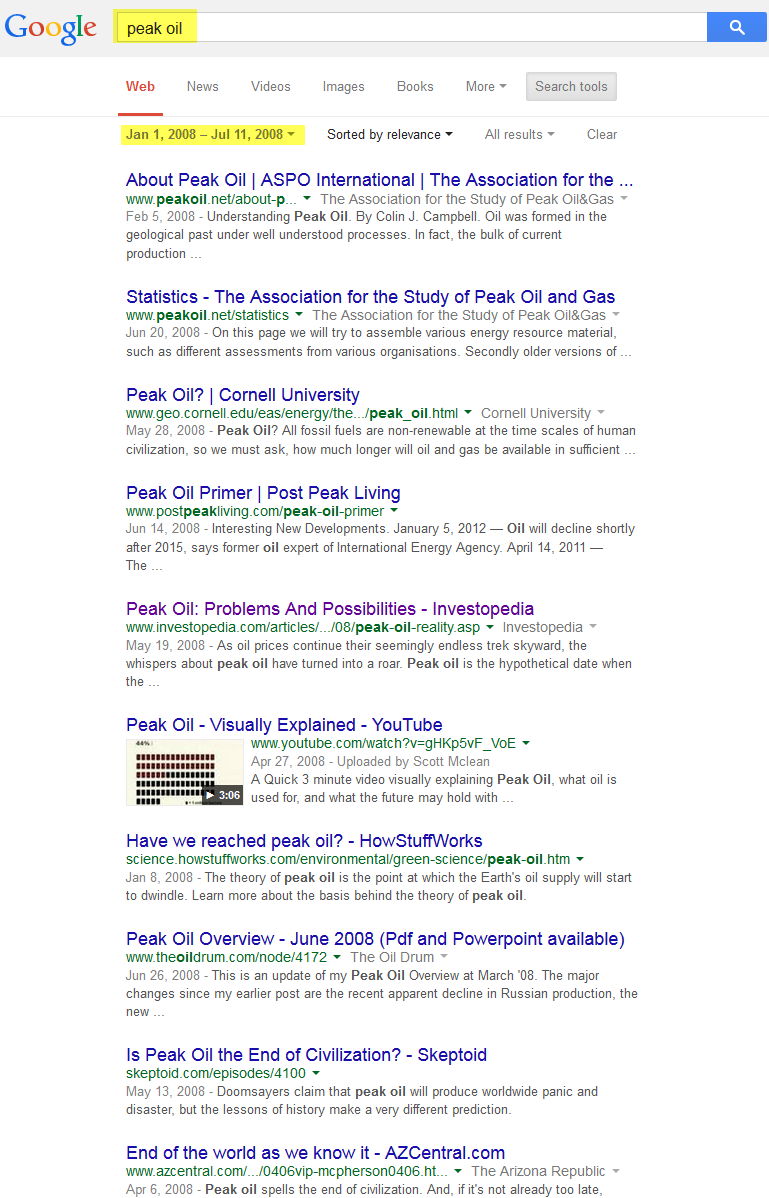
The charts below (in order) are: A 20-year weekly chart Light Crude Oil ($WTIC); a screenshot of a Google search for “Peak Oil”, narrowed down to headlines from Jan 1, 2008 – July 11, 2008 (the week that crude oil prices peaked at their all-time high); a snaphot of the aforementioned Investopedia article showing the “experts” prediction for peak oil; and finally a screenshot of a current (today) Google search for the term “oil production glut” (noting how the vast majority of “experts” predict this glut to continue for years).
-

- $WTIC 20 yr weekly Jan 13th
-
- Google Search- Peak Oil 1-1-08 thru 7-11.08
-
- 2008 Peak Oil Forecasts
-
- Google Search- Oil Production Glut, Jan 13th 2015