
Member @hardsix inquired within the trading room as to whether or not PCLN (The Priceline Group Inc) looked like a potential shorting candidate as the stock is very over-extended. On the first chart below (2-year, daily time frame) potential divergences are in place as PCLN makes the most recent & most extreme overbought reading in years. White circles & arrows highlight the corrections following the previous overbought levels (70+ on the RSI).
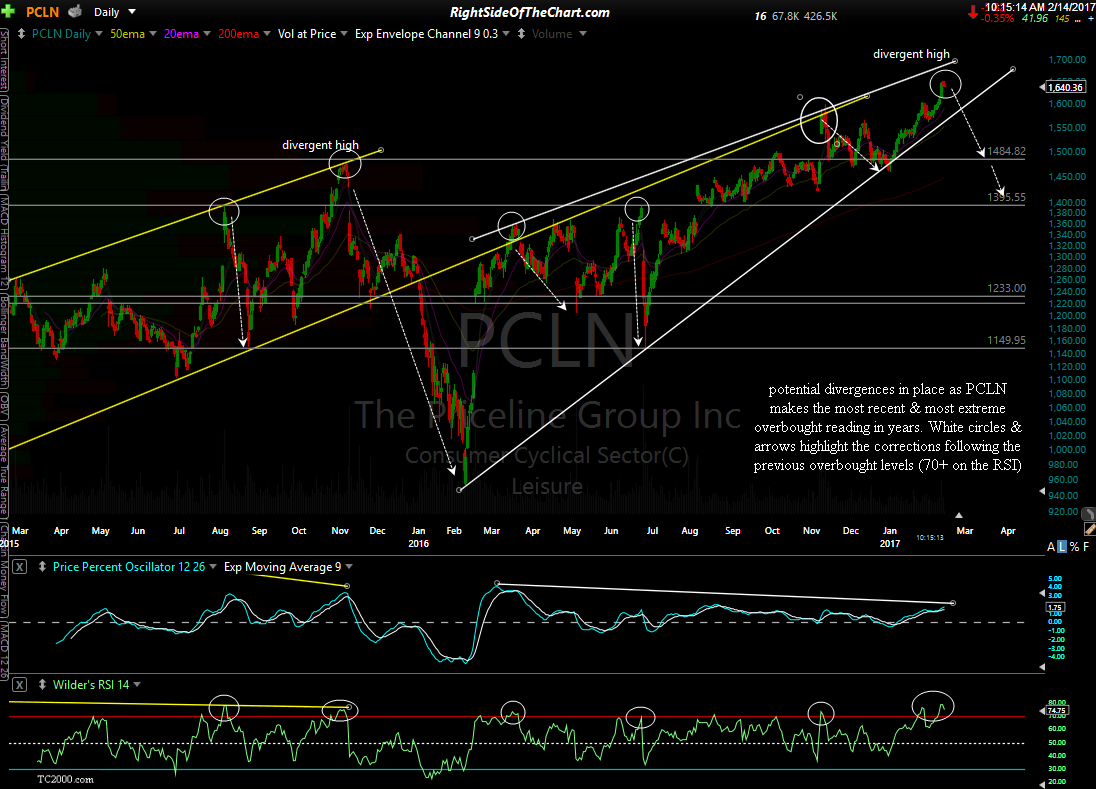
PCLN daily Feb 14th
Zooming out to this 10-year weekly chart, it appears that PCLN is likely to fall to at least the 965 area sometime in 2017 with the most likely catalyst for the correction being a break & weekly close below this large bearish rising wedge pattern (the white uptrend line). I’m only passing this along as an unofficial trade idea at this time as well as a follow-up to @hardsix’s inquiry on the outlook for PCLN. However, Priceline is now on my watchlist as a potential official trade idea & due to the potentially large downside potential in the coming months, I wanted to pass along the setup for others that might be interested.
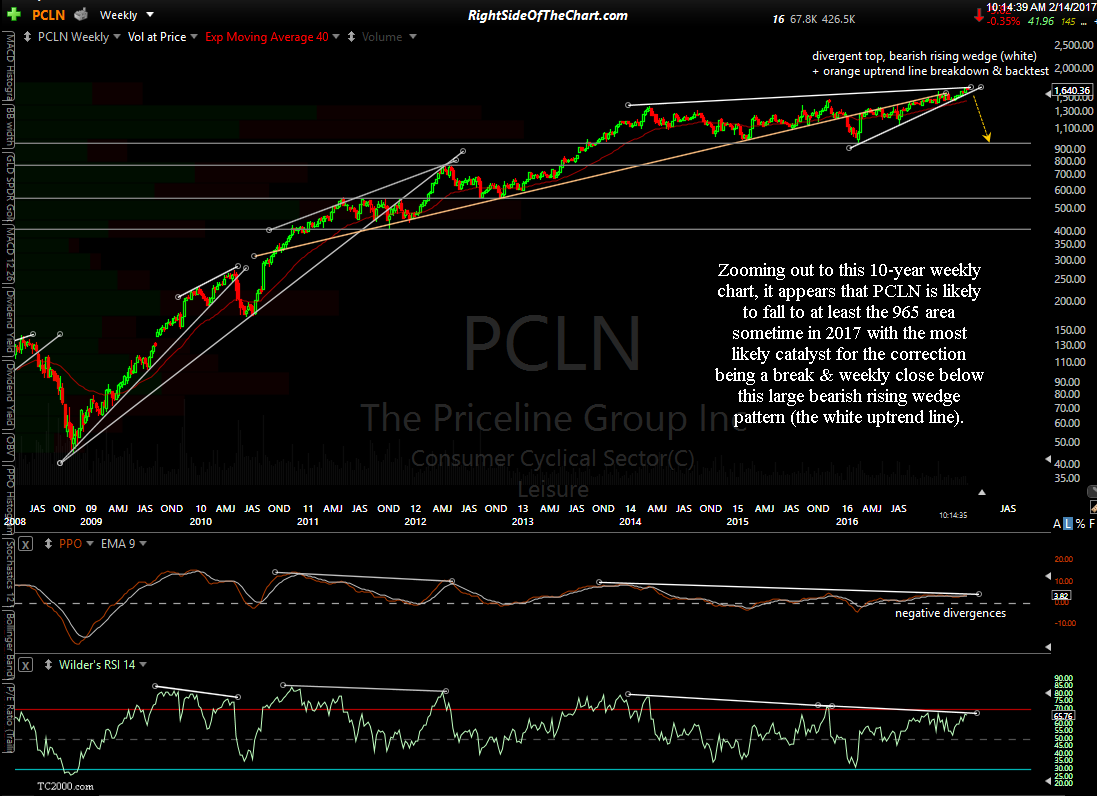
PCLN weekly Feb 14th