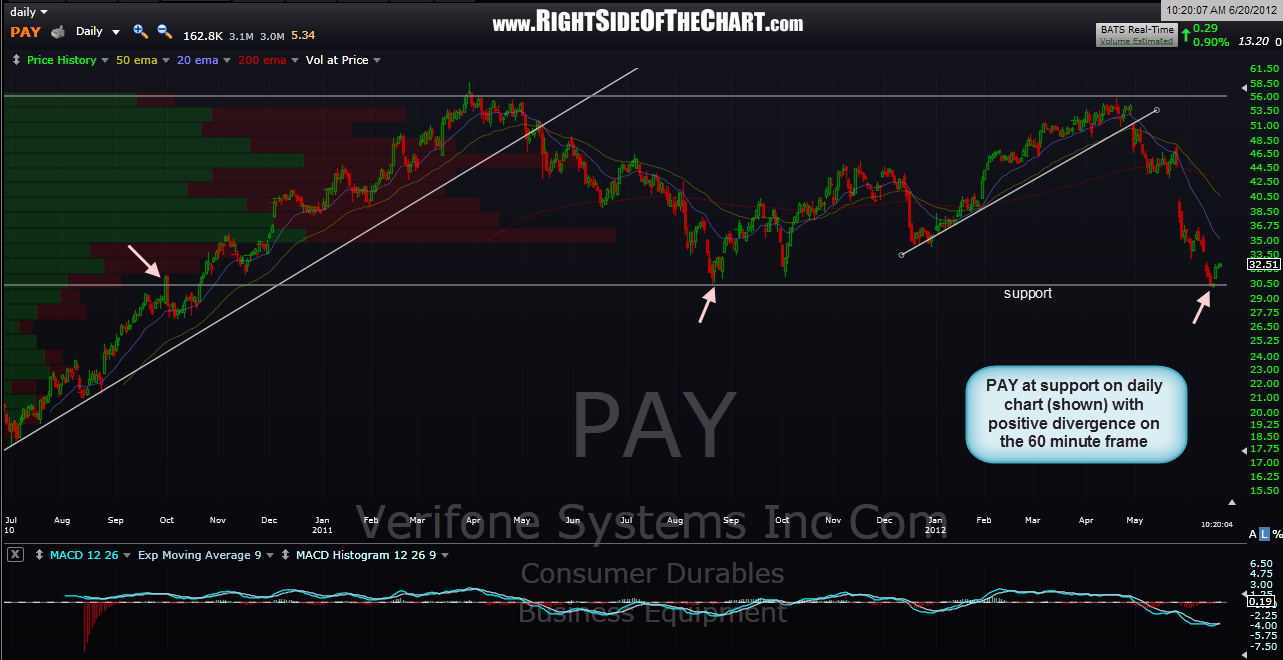
PAY looks like an objective long entry if it can break above R1 (1st resistance level) on this 60 minute chart. this was a stock i have shorted for some nice trades over the last couple of years but has now fallen to a decent support level on the daily chart while very oversold and with positive divergences on the intraday time frames (and a possible recent bullish falling wedge breakout on the 60 minute chart to boot). depending on one’s trading style and risk tolerance, i think an objective stop for a swing trader would be on a solid break or a close below that daily support line but again, i think it would be prudent to at least wait for prices to break above S1 on that 60 minute chart, especially since PAY is trading just below that level now. also make sure that you take (or pass on) trades that align (or don’t align) with your current market bias. personally, i am being very selective with new longs right now because i think the odds of a pullback are elevated but i might be wrong. even if so, a very good technical pattern can still play out if the broad market is moving in the opposite direction. i will continue to post the best looking set-ups, long or short, but you must decide which one’s fit your own trading style and market bias (long or short).

Results for {phrase} ({results_count} of {results_count_total})
Displaying {results_count} results of {results_count_total}