
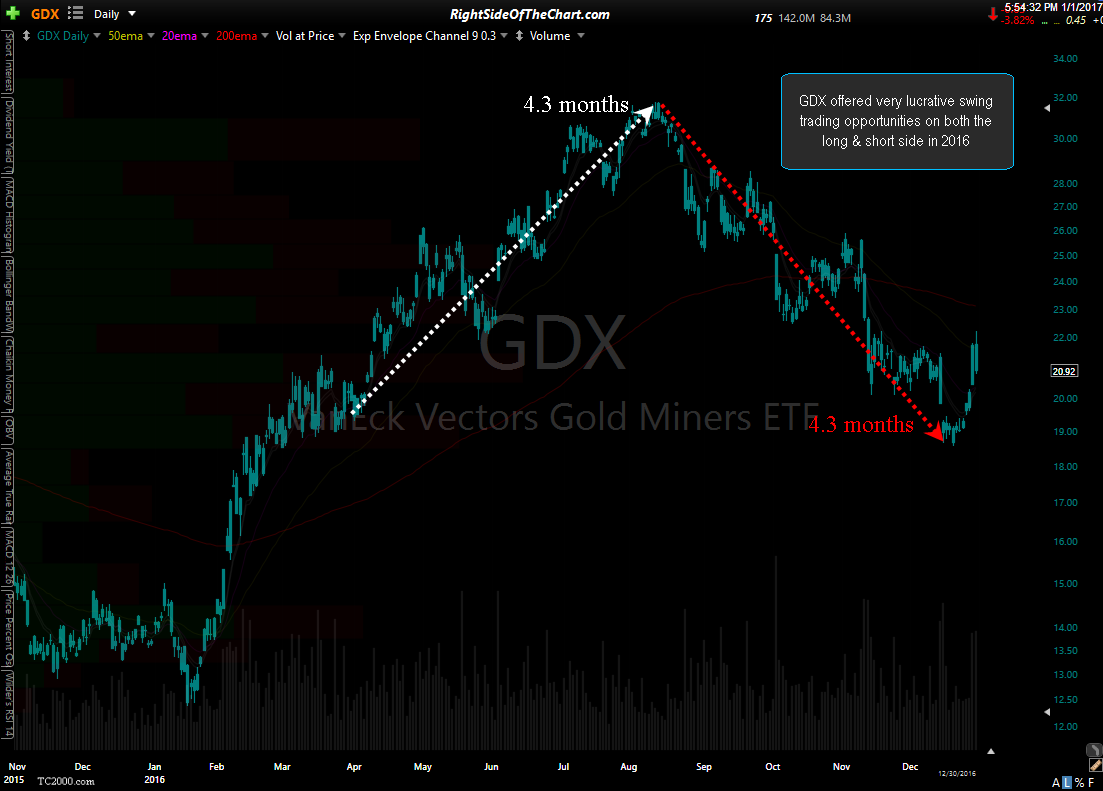
Precious metals (gold, silver, platinum) & the related mining stocks have the potential be one of the more promising swing trading opportunities in 2017. Last year was marked by a very strong rally in gold, silver & the PM mining stocks that kicked off right around the beginning of the year, peaking out around mid-year (early July for gold & early August for GDX & silver) only to be followed by a 4.3 month sharp correction in GDX that was a near mirror of the 4.3 month rally leading into the early August highs… a great example of the benefits of swing trading, especially both long & short, vs. buy & hold (hope) investing.
-

- GDX 2016 Rally & Correction
-

- GDX daily 1 Jan 1st
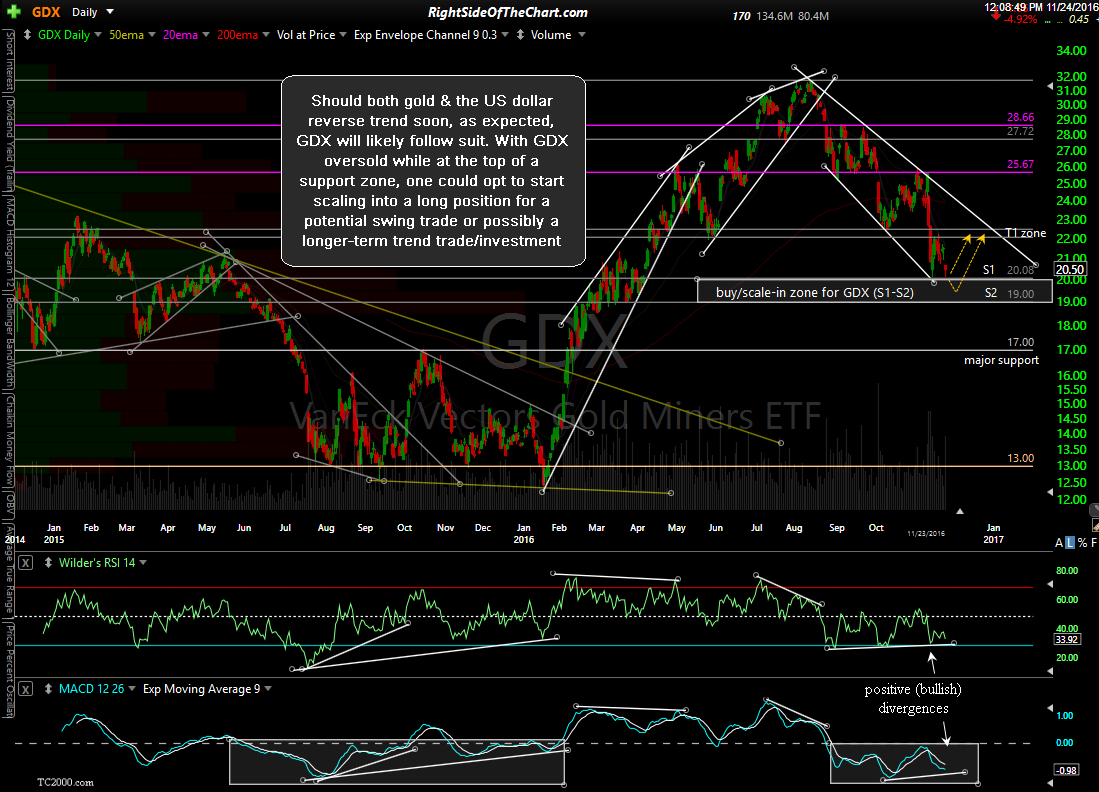
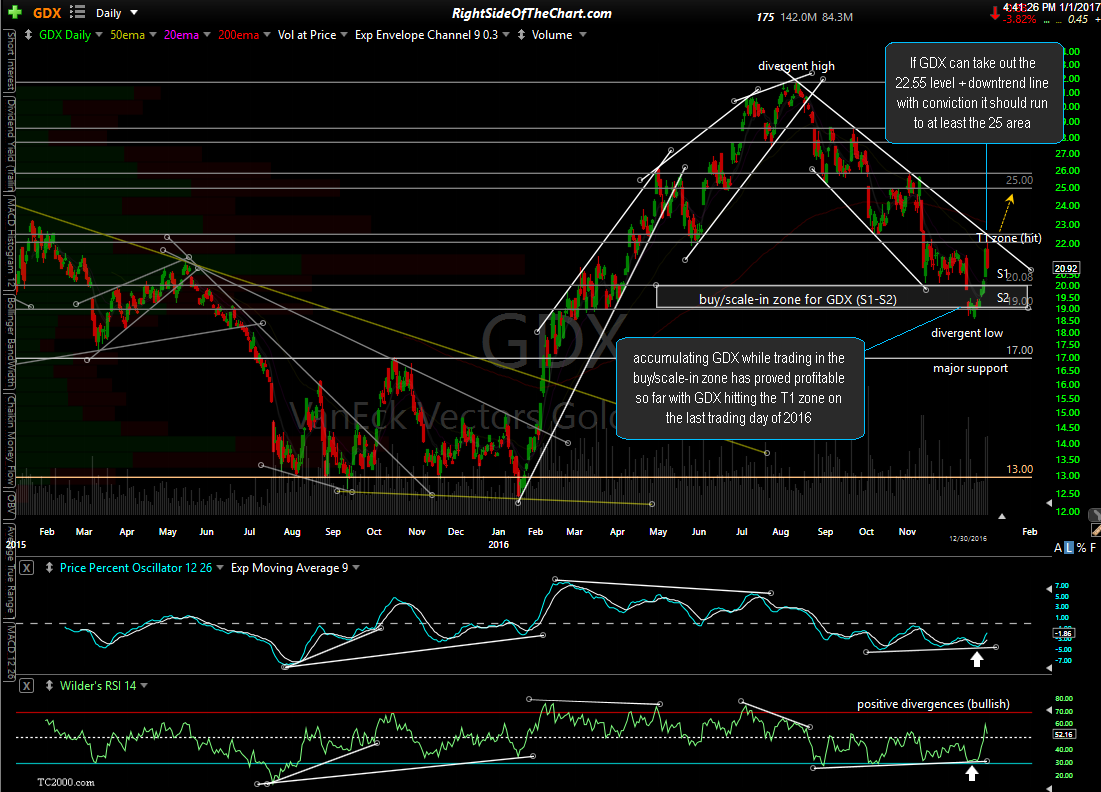
Accumulating GDX within the buy/scale-in zone, as first suggested back on Nov 24th (first chart below) has so far proved profitable with GDX hitting the first target zone on the last trading day of 2016. Should GDX take out the downtrend line + 22.55 R level (top of T1 zone), a rally to at least the 25 area is quite likely.
-
- GDX daily Nov 24th
-

- GDX daily Jan 1st
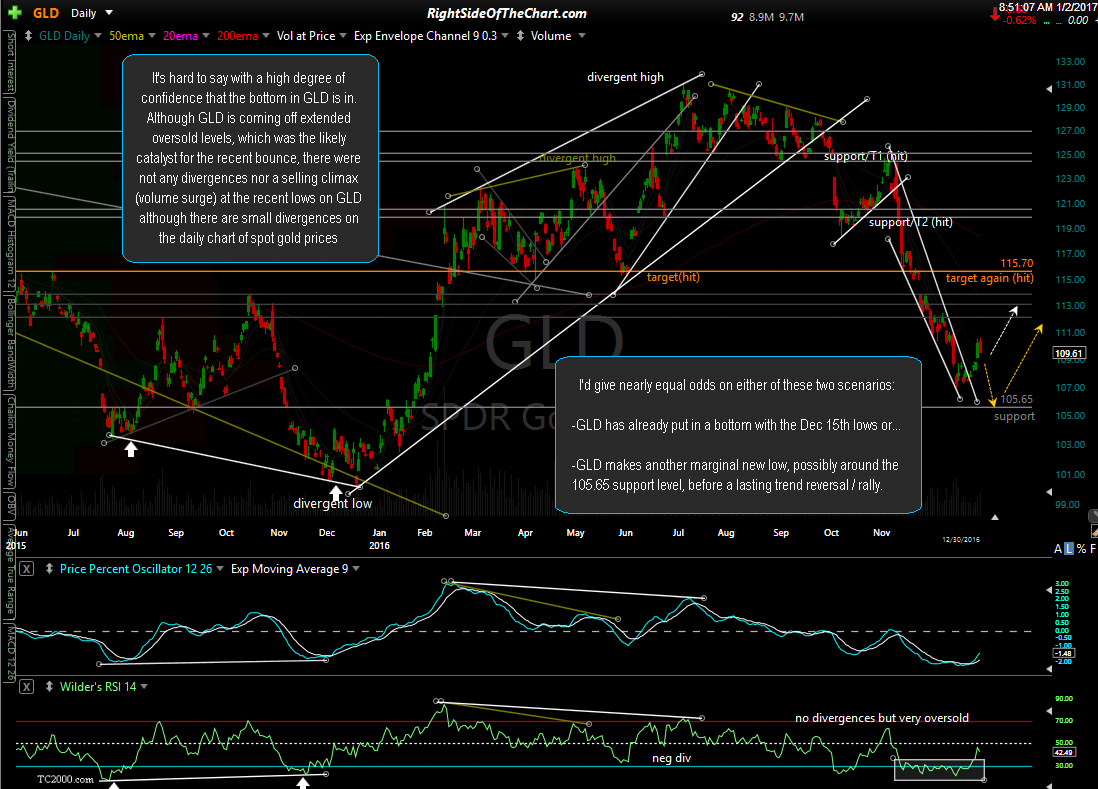
Barring the occasional disconnects, the miners will ultimately move in conjunction with the metals so to get the call on the miners correct you need to correctly identify & forecast the trend in the precious metals, particularly gold. While it appears likely that a meaningful trend reversal in gold (from bearish to bullish) is close at hand, at this time I would give nearly equal odds that gold has either bottomed in mid-December or has one more leg down with a marginal new low coming soon before a meaningful & lasting bottom is put in.
-
- GLD daily Jan 1st
-

- $GOLD daily Jan 1st

-
- $GOLD weekly Jan 1st

-

- GLD 60-minute Jan 1st

Some of the recent bullish developments with gold are the extended oversold conditions (RSI below 30) on the daily time frame as well as a recent oversold reading on the weekly chart, both of which (weekly & daily oversold reading) have historically accompanied or slightly preceded counter-trend bounces and/or lasting bottoms in gold. Gold is also currently back-testing a significant downtrend line as shown on the daily & weekly charts of $GOLD (spot gold price) above. While GLD (gold etf) just barely took out the potential positive divergences that were forming until the MACD, PPO & RSI just recently made a slightly lower new low, there is positive (bullish) divergence in place on the $GOLD daily chart as well as the GLD 60-minute time frame. Following the recent breakout above this minor downtrend line along with the 60-minute trend indicators flipping to bullish, GLD looks poised to rally up towards the late Nov gap around the 113.85-114.95 area, especially if this minor uptrend line contains any pullbacks.
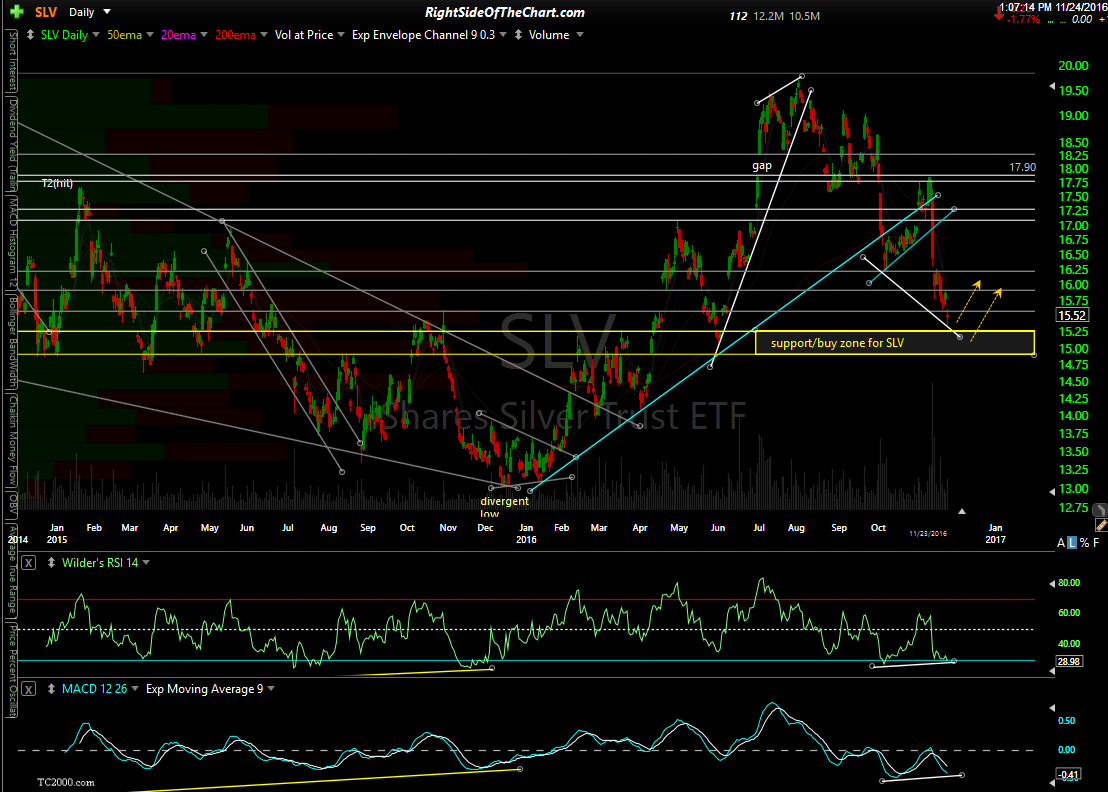
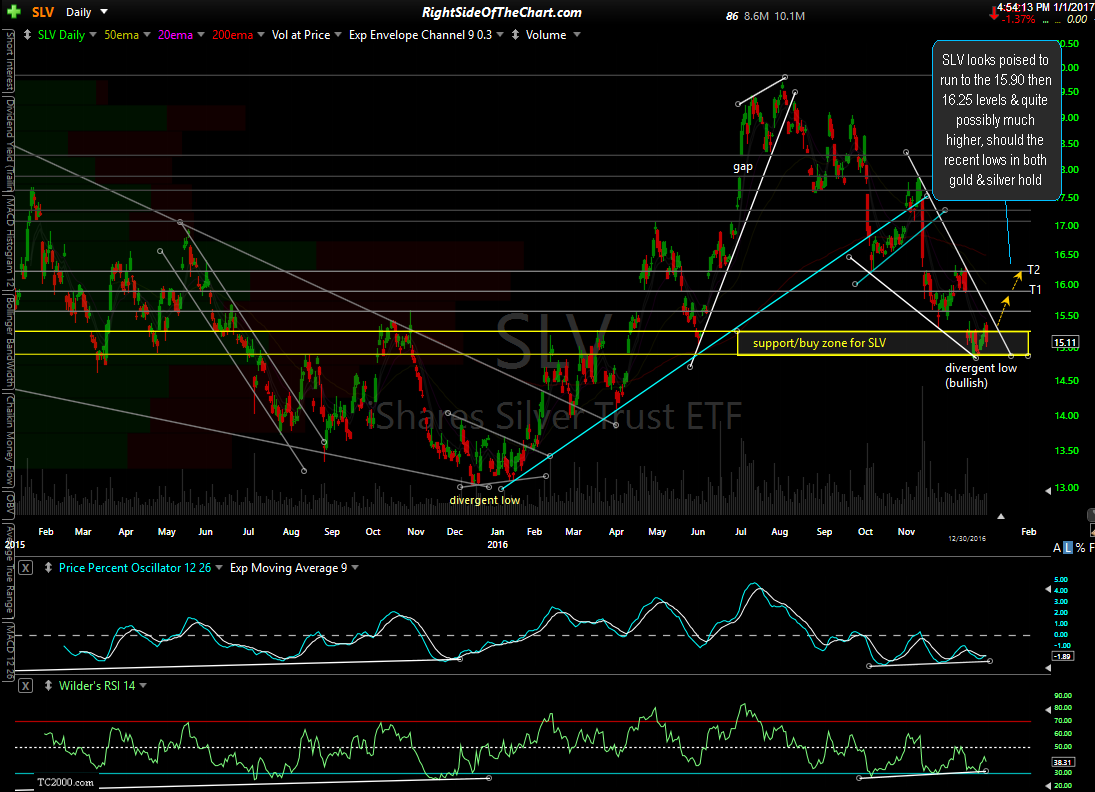
Moving on to “the other shiny metals”, SLV (silver etf) looks poised to run to the 15.90 then 16.25 levels & quite possibly much higher, should the recent lows in both gold & silver hold. Since first posting the support/buy zone for SLV back on Nov 24th (first chart below), SLV went on to continue to the bottom of that support zone, which held like a champ on several drops to that level so far going on to close the year smack in the middle of that support zone with the bullish divergences on the MACD, PPO & RSI still well intact (second chart).
-

- SLV daily Nov 2th
-

- SLV daily Jan 1st
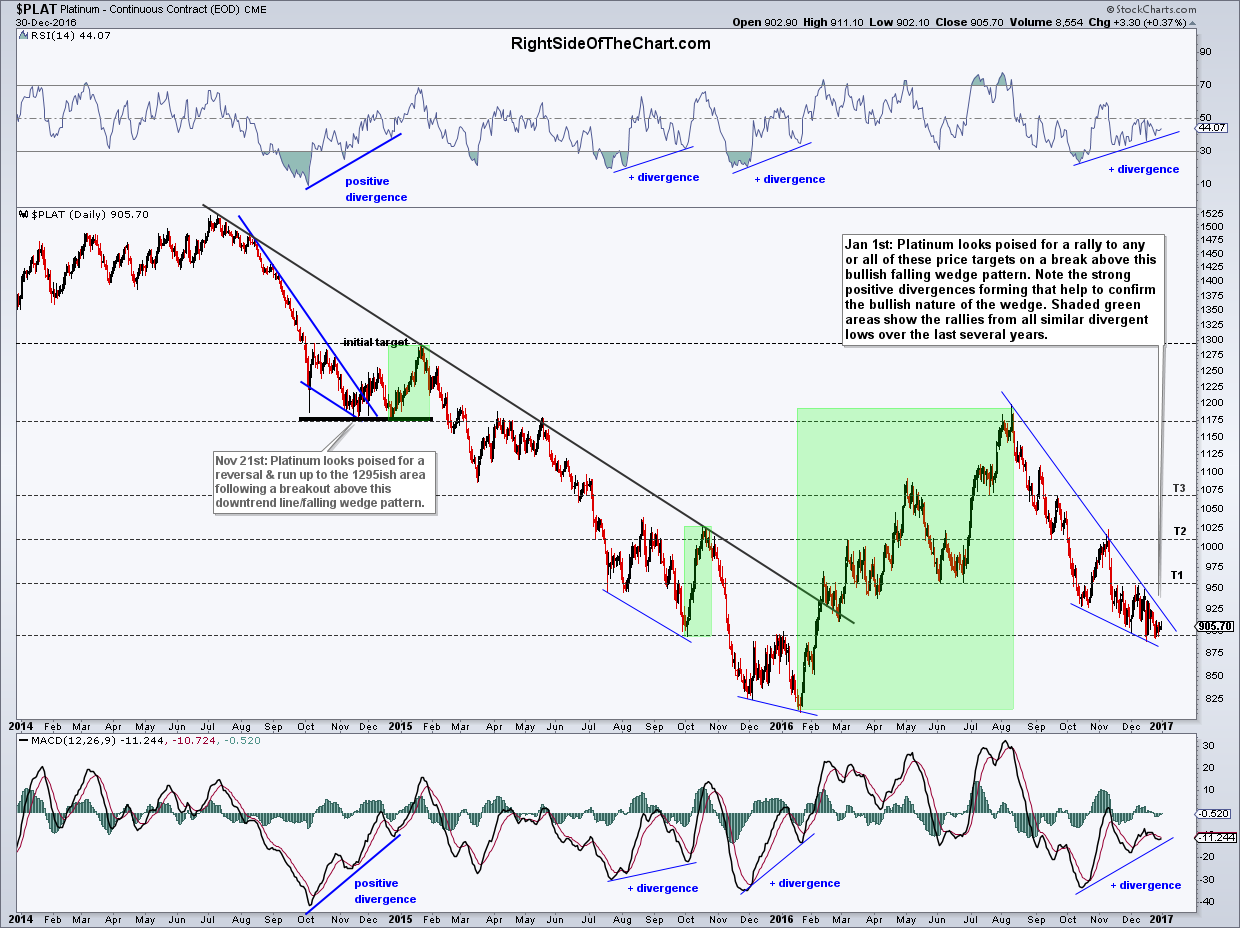
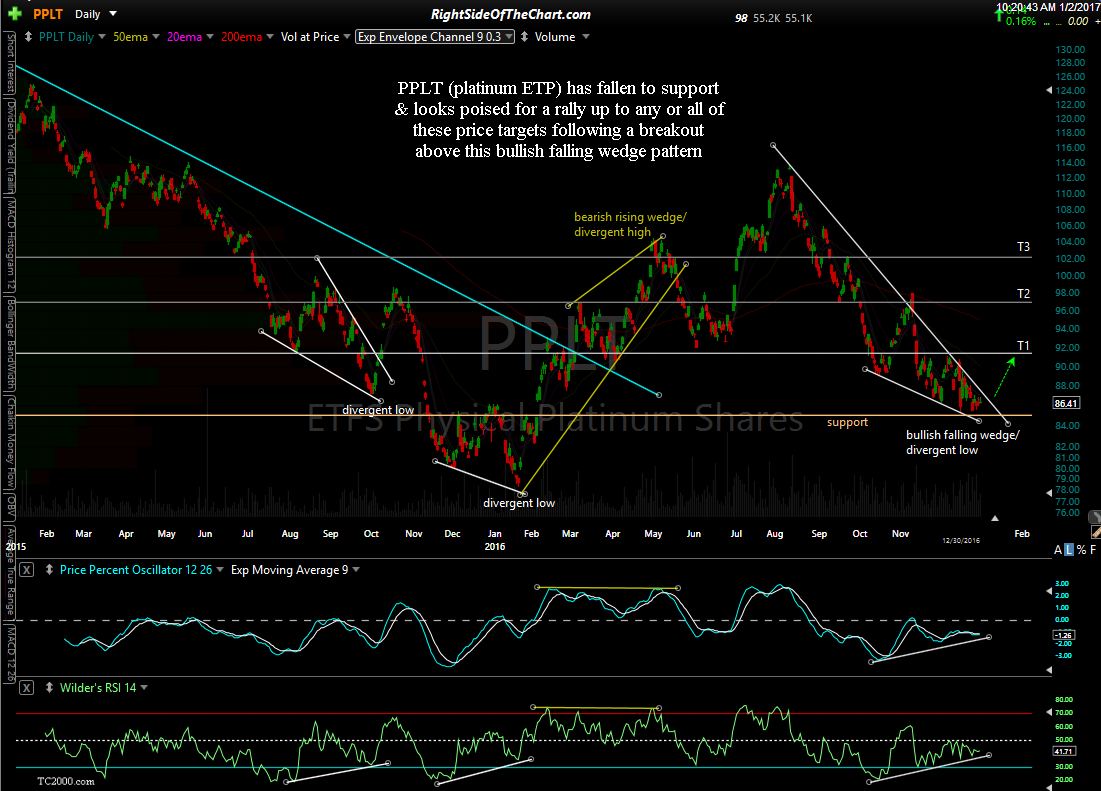
Although a decent case for a rally in gold & silver in the coming weeks & months can be made, I’d have to say that platinum stands out as one of the better looking long setups within the precious metals at this time. I’ve included the daily charts for both $PLAT (platinum) and PPLT (ETFS Physical Palladium Shares, an exchange traded product), both of which have fallen to support & look poised for a rally up to any or all of these price targets following a breakout above this bullish falling wedge pattern.
-
- $PLAT daily Jan 1st
-
- PPLT daily Jan 1st
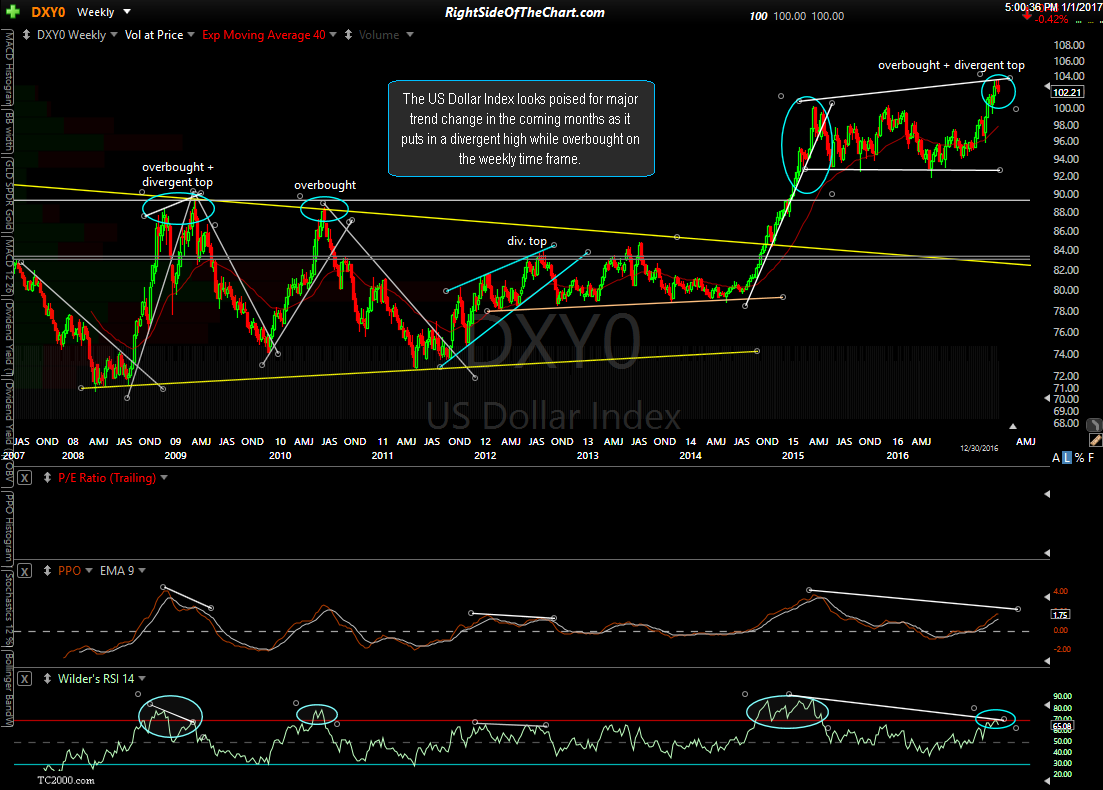
Finally, a comprehensive analysis of precious metals wouldn’t be complete without including the outlook for the US Dollar as historically, there has been a fairly consistent inverse correlation between gold & the dollar. The US Dollar Index looks poised for major trend change in the coming months as it puts in a divergent high while overbought on the weekly time frame (first chart below). Just as I like to confirm my analysis on gold with the outlook for the US Dollar, I also like to confirm my outlook for the US Dollar with the technicals of the Euro, as the Euro comprises the bulk of the US Dollar index as the largest component with a weighting of 57.6%.
-

- $DXY weekly Jan 1st
-
- EUR-USD weekly Jan 1st
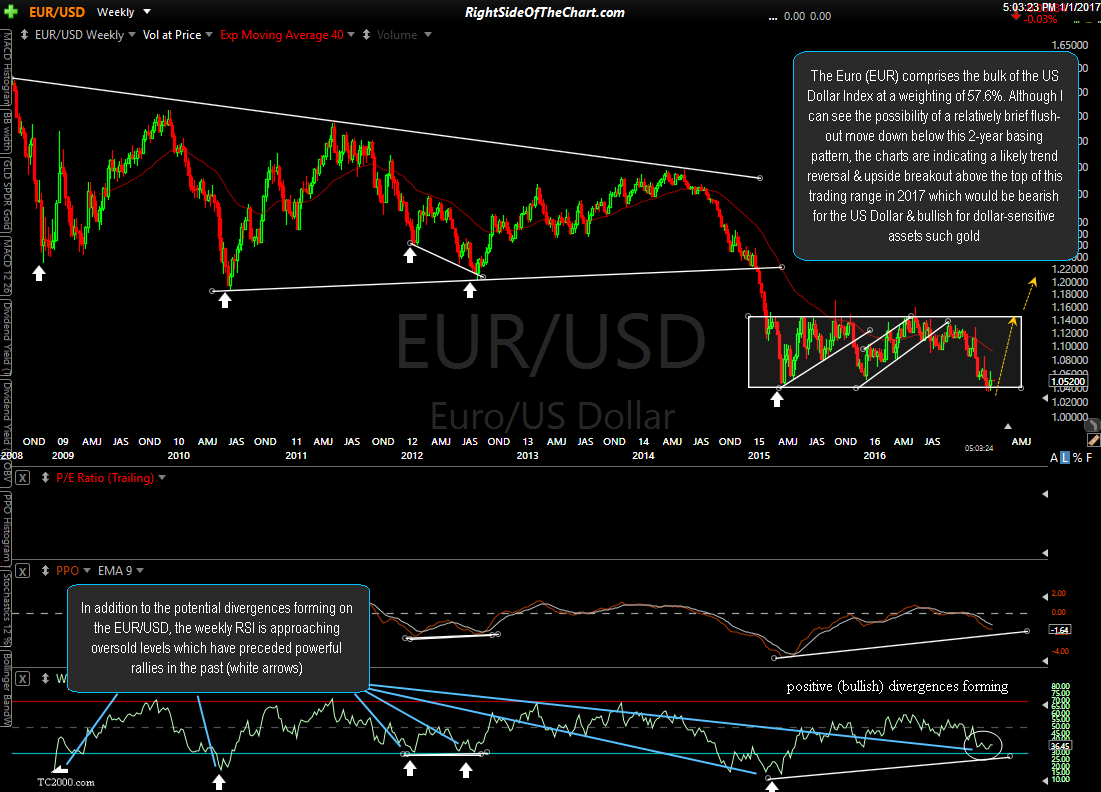
Although I can see the possibility of a relatively brief flush-out move down below the 2-year basing pattern on the weekly chart of the EUR/USD above, the technicals seem to indicate a likely trend reversal & upside breakout above the top of the current sideways trading range in which the pair has traded over the last 2 years. Such a breakout would be bullish for the Euro & bearish for the Dollar as well as dollar sensitive assets such as gold.
On a final note, I’d like to wish everyone a very happy, healthy & prosperous new year!
-Randy Phinney