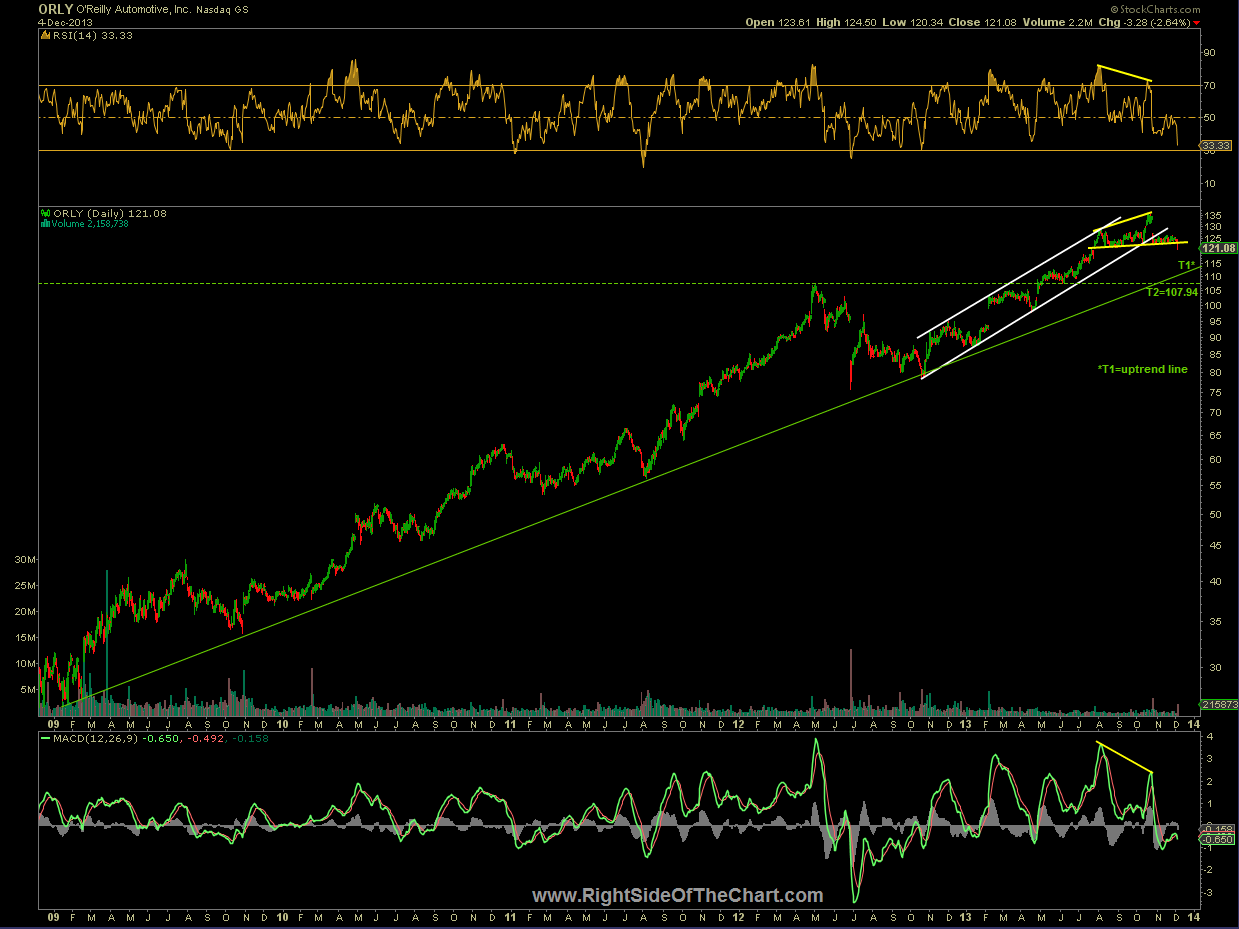
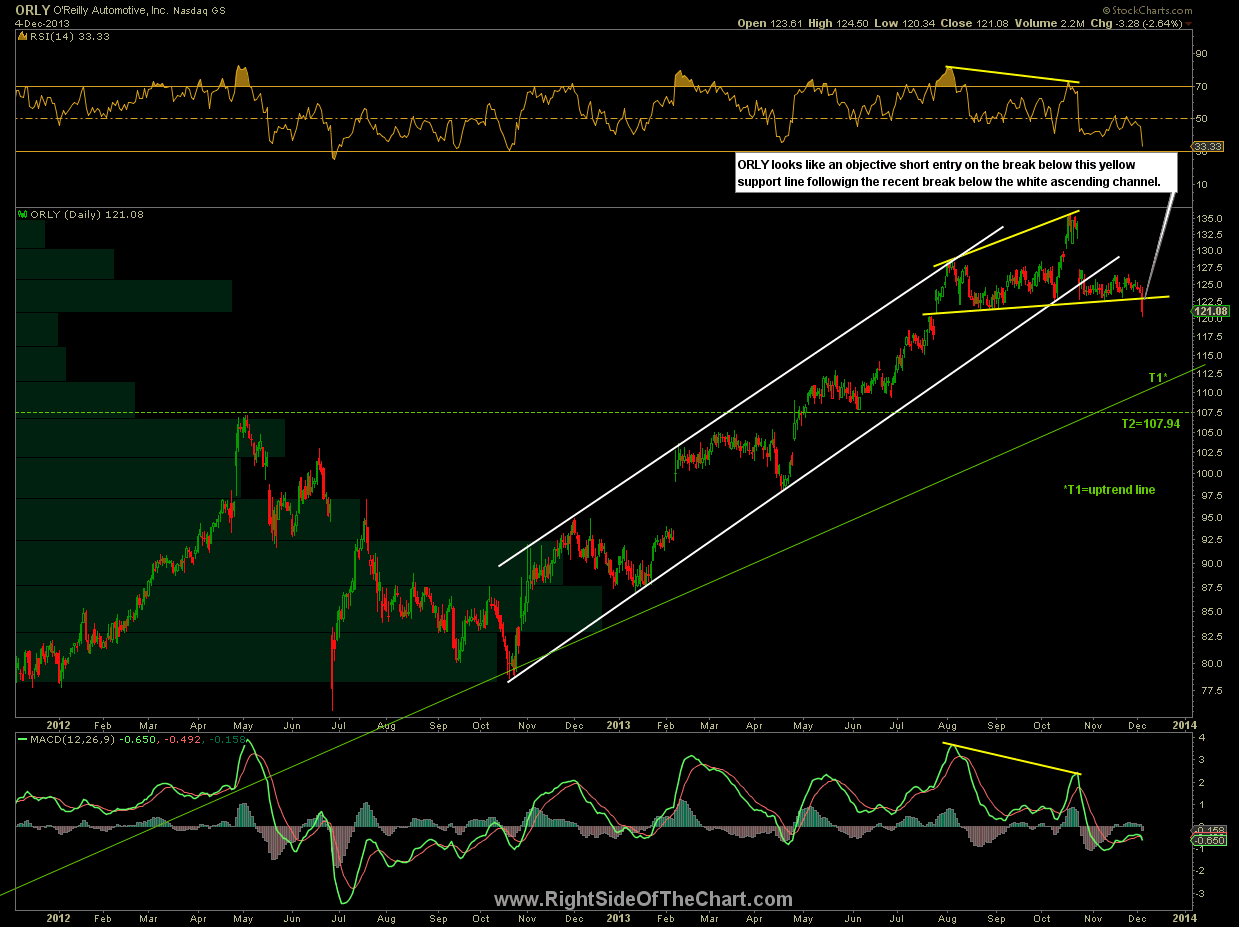
ORLY (O’Reilly Automotive Inc) looks like an objective short following yesterday’s breakdown below this yellow support line which also follows the recent breakdown below the white ascending price channel (complete with negative divergences in place at the recent highs). My first price target will be the primary uptrend line, which can be viewed on the 5-year daily chart below. T2 at 107.94, is placed just above the green horizontal support level (to help assure a fill). With all but the shortest-term trend indicators still on buy signals, I’d have to favor T1 at this time. However, the bearish divergences & extreme sentiment readings that have persisted from months are still in place and have only grown to even larger, potentially more bearish extremes. As such, my preferred target my very likely be extended to T2 should we begin to see some half-decent evidence that a correction in the broad markets is likely underway. Note: The static charts below were made before the market opened today. Click here to view the live 2-year daily chart of ORLY.
-

- ORLY 2-year daily chart
-
- ORLY 5-year daily chart