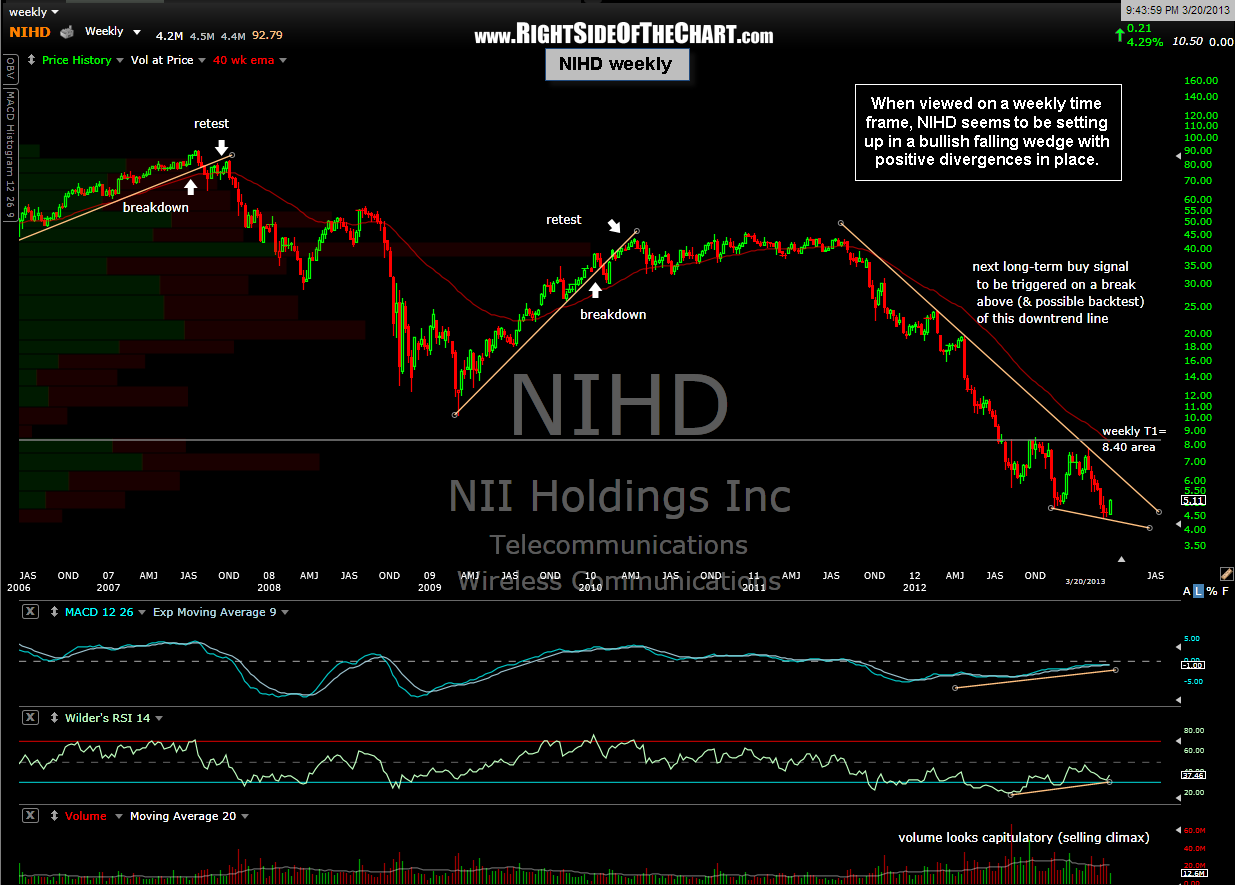
 On March 20th, when the previous short-term trade on NIHD hit the first profit target based off the 60 minute time frame, it was stated that the stock had the potential to be a long-term swing trade as the weekly chart was setting up very bullishly. The trigger for that trade was to be a break of the weekly downtrend line, shown on this first chart posted that day (right). However, I missed the breakout and the stock recently peaked at over 92% from where it was trading in that post around 7 weeks ago. As the move was too fast to chase by the time I noticed the breakout, I had stated in a follow-up post that a decent pullback, especially on to retest that wedge pattern from above, might offer another objective entry.
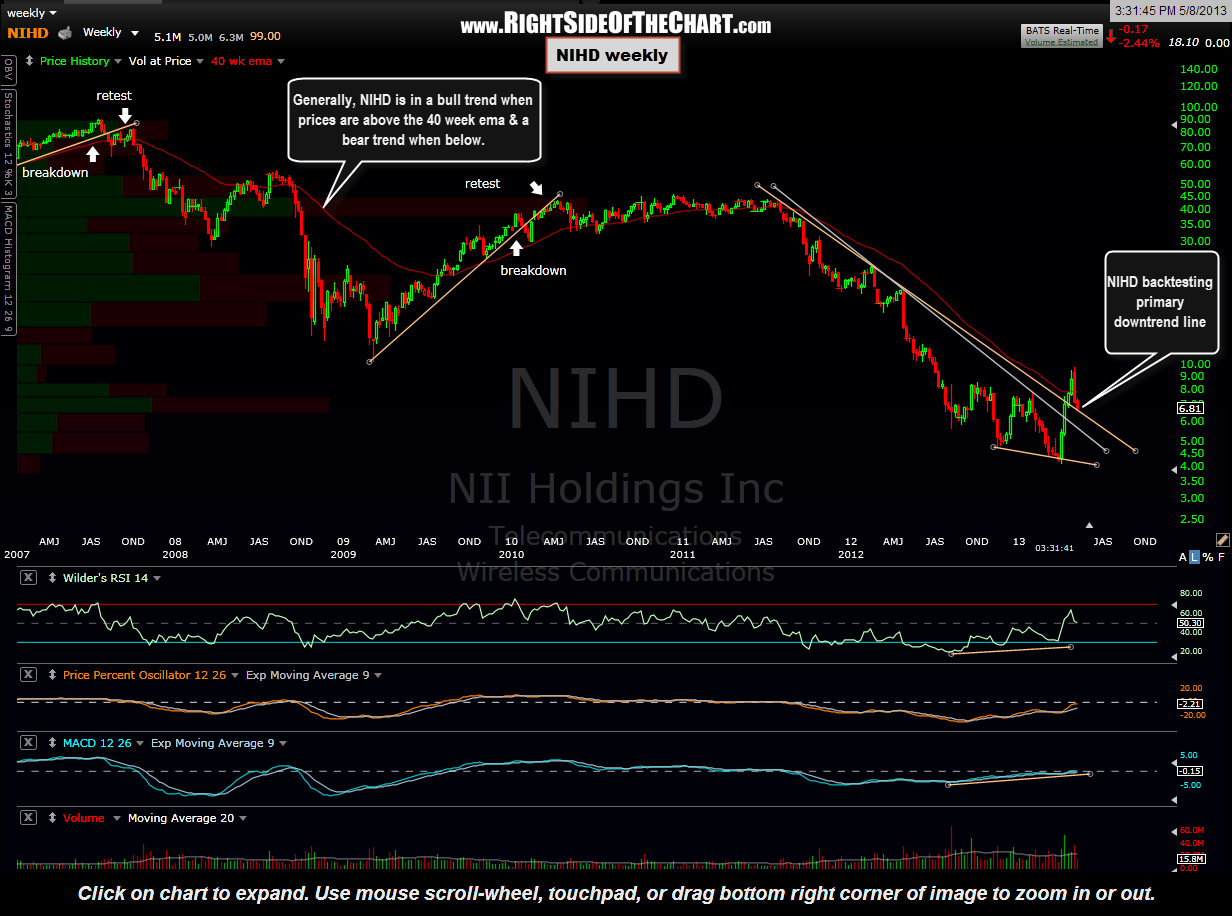
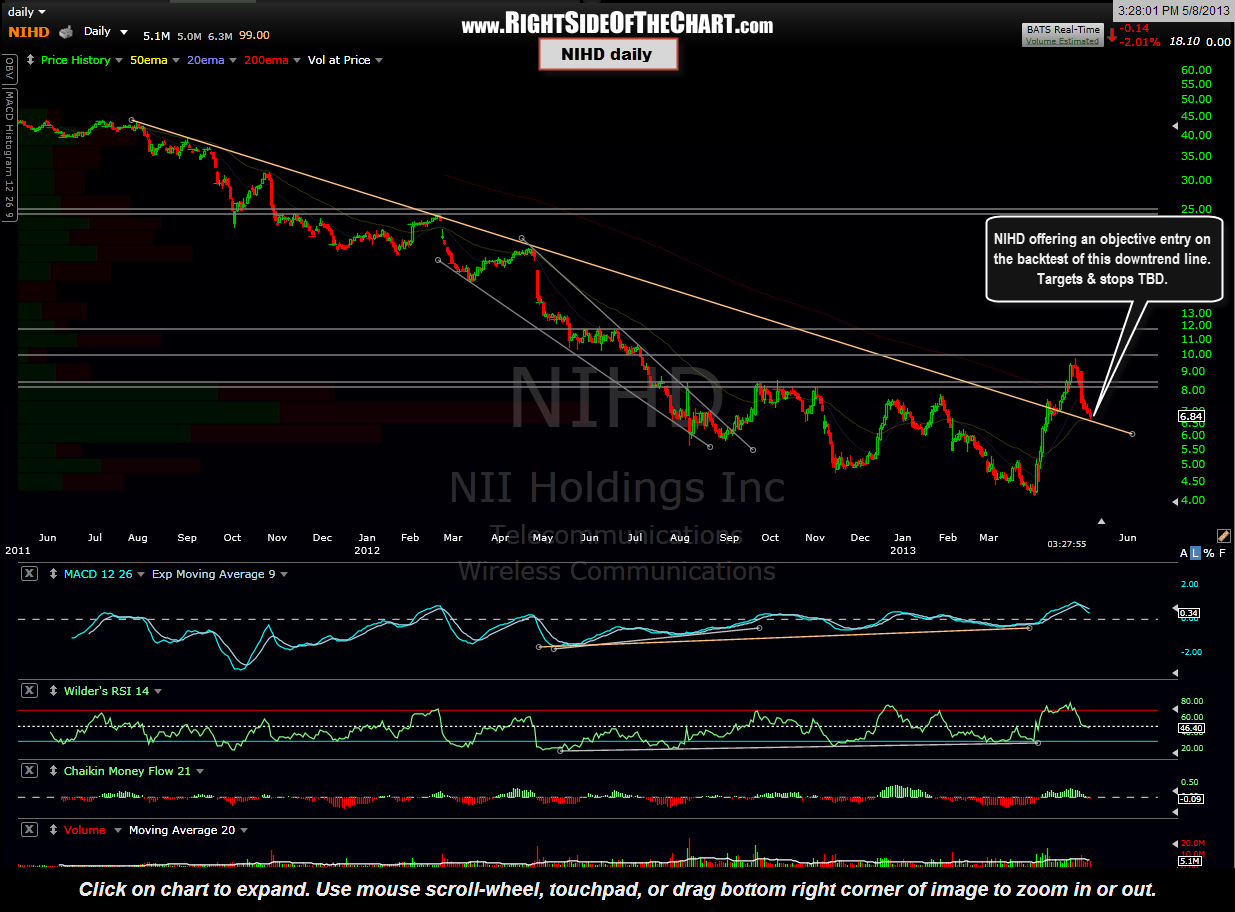
The charts below are the updated daily & weekly charts. Although I had the top of the original wedge drawn using what is now the white downtrend line, I believe this updated weekly downtrend line (orange), which also aligns with the daily downtrend line shown below, is a more significant level. Therefore, NIHD offers an objective entry around current levels for a long-term (multi-month+) trade or investment opportunity. Like most new positions at this time, my preference will be a scale-in strategy using relatively small lots at this time. Stops and targets TBD soon.