
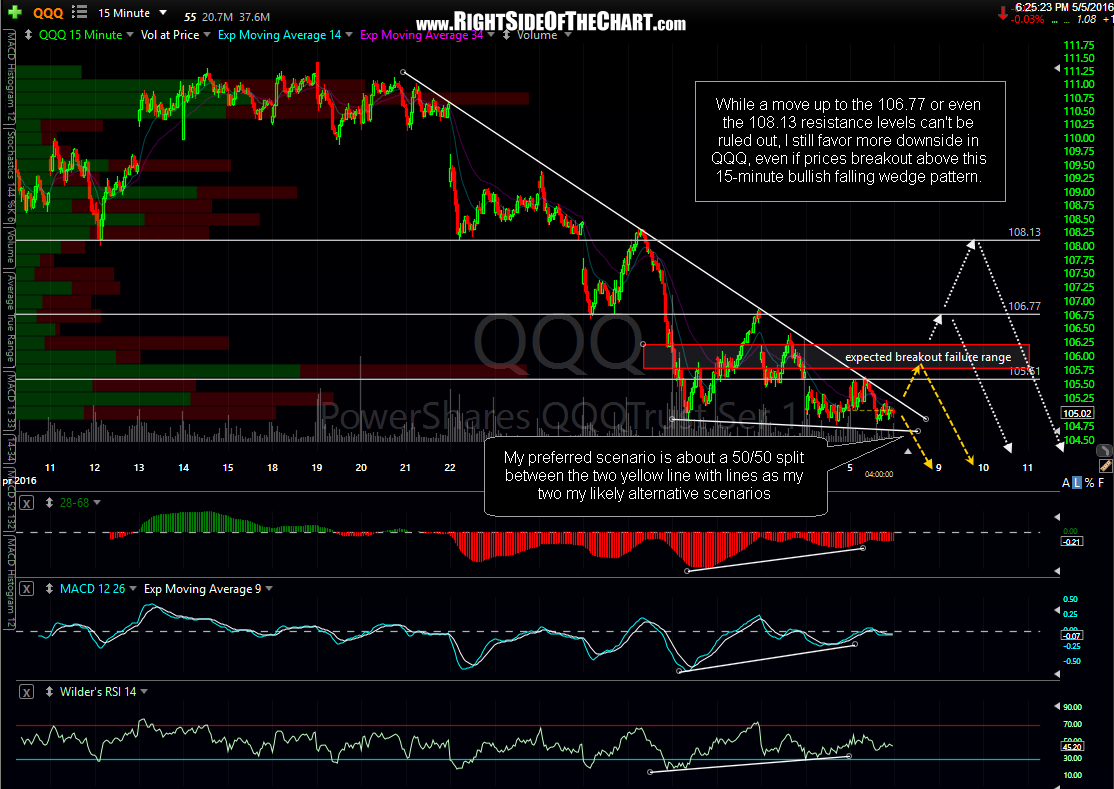
While a move up to the 106.77 or even the 108.13 resistance levels can’t be ruled out, I still favor more downside in QQQ, even if prices breakout above this 15-minute bullish falling wedge pattern. My preferred scenario is about a 50/50 split between the two yellow line with lines as my two my likely alternative scenarios.
-

- QQQ 15-minute 2 May 5th
-
- QQQ 60-minute May 5th

-
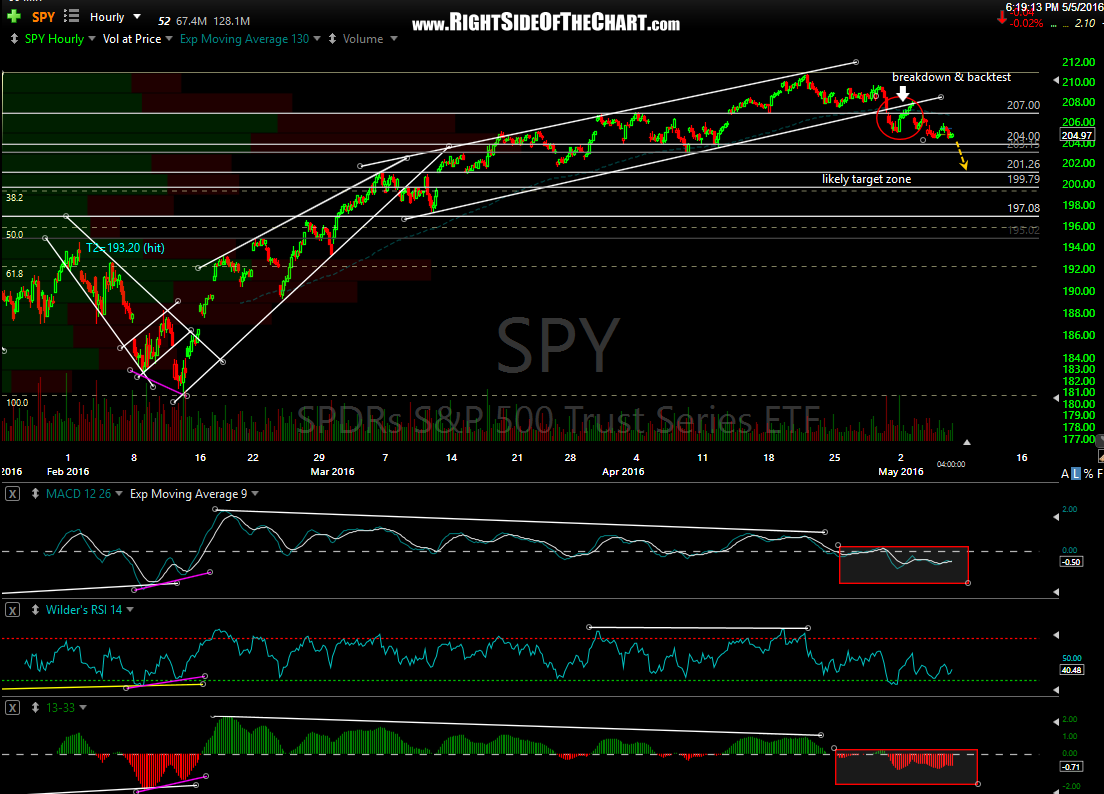
- SPY 60-minute May 5th
-
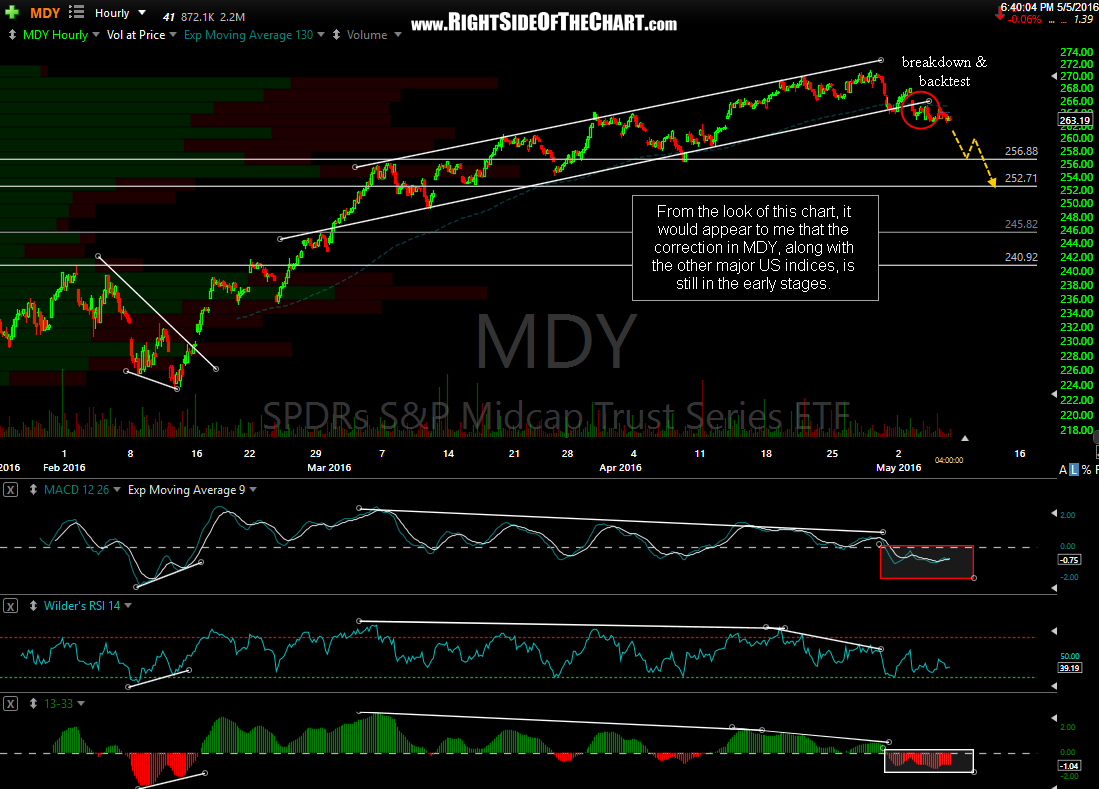
- MDY 60-minute May 5th
-
- IWM 60-minute May 5th

To be clear, I favor my downside in the coming days & possibly weeks+ but in the very near-term, I would say it’s a coin-toss between a gap up followed by a relatively short-lived rally tomorrow or a gap down & continued move lower towards my next price target of 103.35. As these 60-minute charts highlight, all major US indexes, such as SPY, QQQ, MDY & IWM remain on solid sell signals with both the MACD & 13/33-ema histogram trading below their respective zero lines and prices only just recently breaking down below well defined bearish rising wedges or price channels, all of which were confirmed with solid negative divergences before the breakdowns.