Same old story in the broad equity markets although we are finally starting to see some cracks in the “Big Five” that I’m watching (AAPL, GOOG, MSFT, AMZN & FB). First let’s take a look at the broad market, starting with SPY. Negative divergences continue to build as SPY grinds slowly but steadily higher on low volume. However, we are still awaiting the following sell signals:
-Break of S1 /wedge followed by a break below the key S2/215.30 level (support levels)
-MACD 9-ema cross below zero line (trend indicator)
-13/33ema histogram cross below zero line (trend indicator)

SPY 60-minute Aug 15th
Similar story in QQQ as with SPY. Prices continue to grind slowly higher with the first, early sell signal to come on a break below this ascending price channel, followed by a break below the 114.12 support level & both the MACD signal line & 13/33ema histogram crossing below their respective zero lines to flip those trend indicators to bearish for the first time since June. The remaining lesser indices (MDY, IWM, etc..) have very similar technical postures & as they almost always do, will most likely follow the large caps lower, should these bearish setups begin to play out soon.
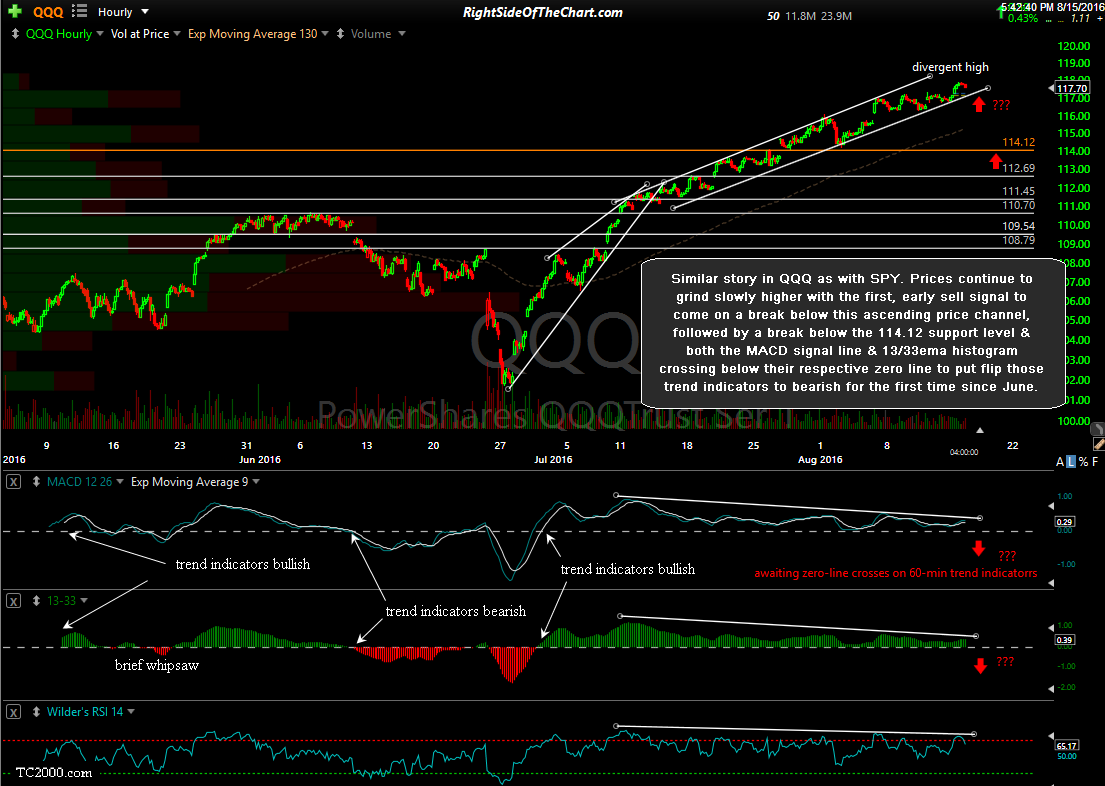
QQQ 60-minute Aug 15th
Regarding the ‘Big Five’, Apple looks to be holding up better than the rest of the pack. Despite a few false breaks below this 60-minute uptrend line, the trend indicators remain comfortably in bullish territory as of today’s close but negative divergences continue to build as AAPL grinds higher.

AAPL 60-minute Aug 15th
Cracks are starting to appear on GOOG with prices closing below this 60-minute wedge for the first time today, following the recent divergent high and both the MACD & 13/33 trend indicators poised to signal their first bearish readings since June on any additional downside in the stock in the coming sessions.

GOOG 60-minute Aug 15th
MSFT has already broken down below its bearish rising wedge pattern with confirmation on the sell signal to come on a break below the 57.60 level as well as the zero line on the MACD 9-ema & the 13/33-ema histogram.
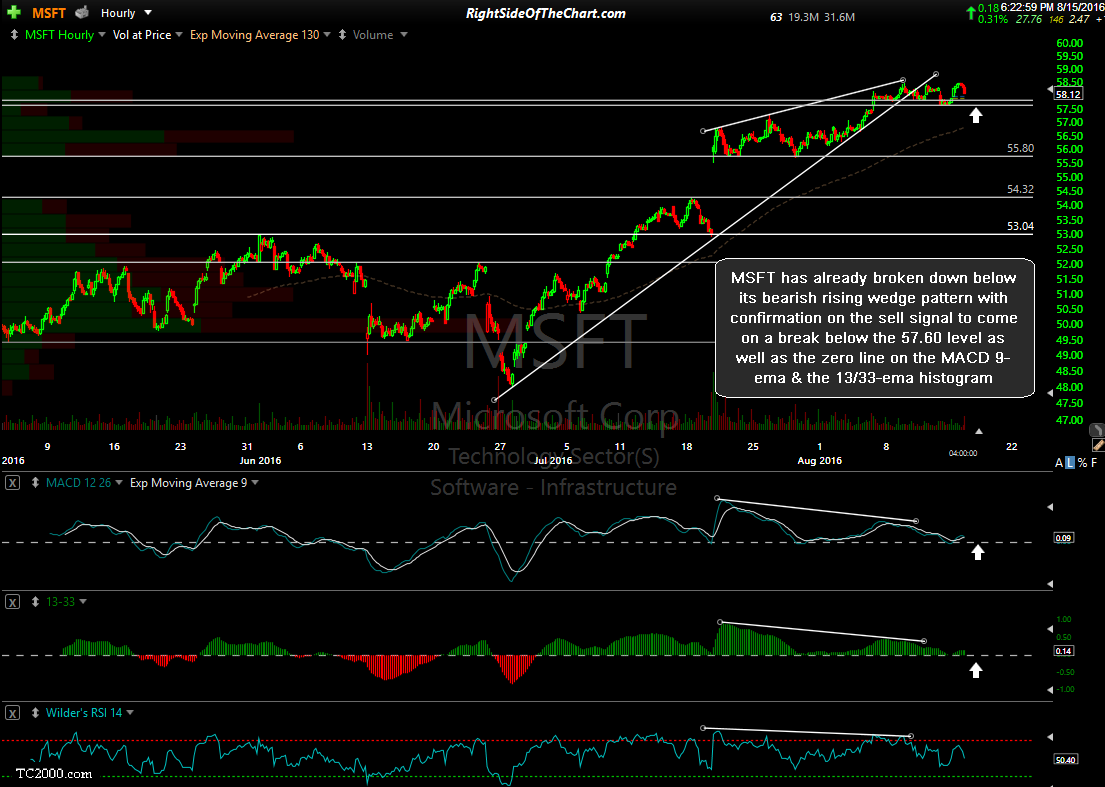
MSFT 60-minute Aug 15th
As with GOOG, AMZN broke & closed below its rising wedge pattern today & awaits confirmation via the MACD & 13/33 trend indicators.

AMZN 60-minute Aug 15th
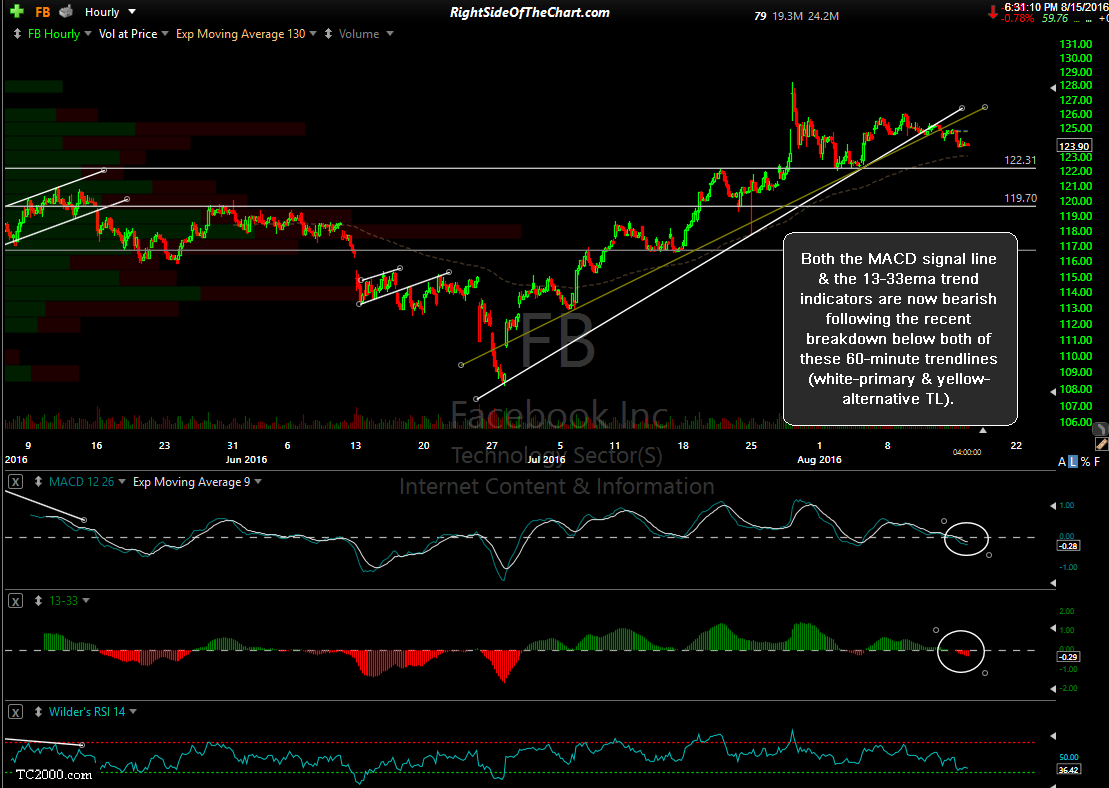
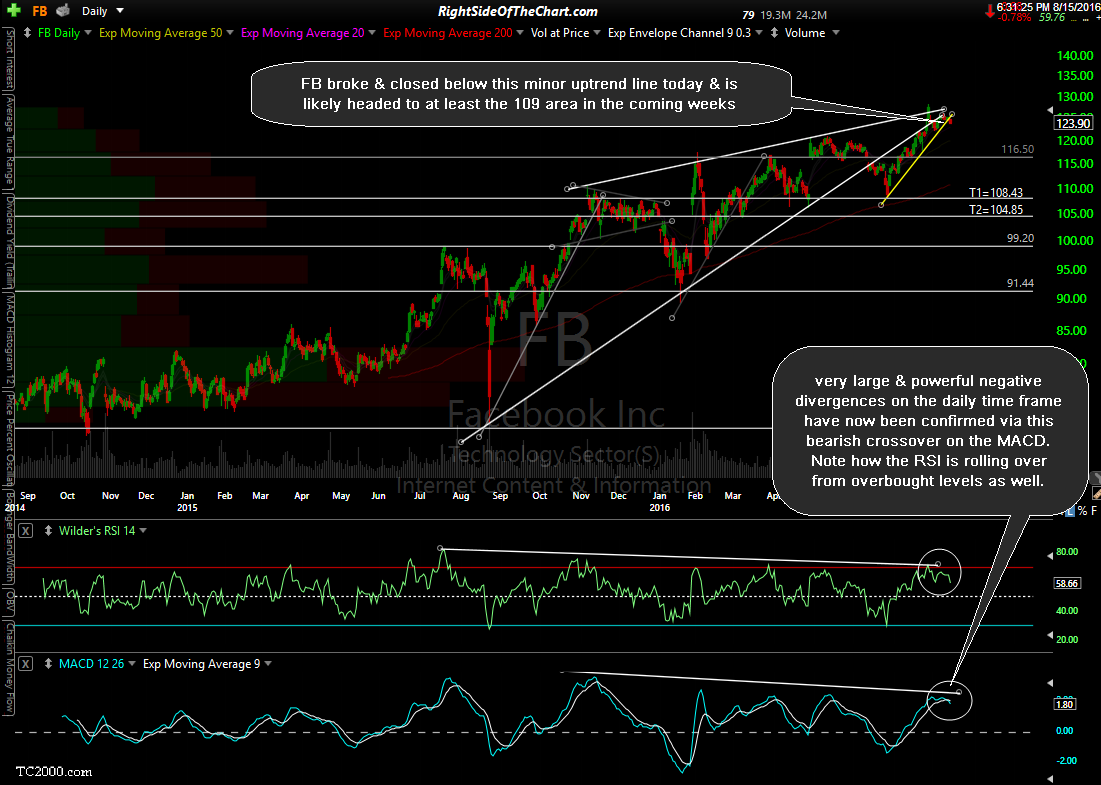
Last but certainly not least is FB (Facebook Inc). The very large & powerful negative divergences on the daily time frame have now been confirmed via this bearish crossover on the MACD. Note how the RSI is rolling over from overbought levels as well. Also worth noting is the fact that FB broke & closed below this minor uptrend line today & is likely headed to at least the 109 area in the coming weeks. On the 60-minute time frame, both the MACD signal line & the 13-33ema trend indicators are now bearish following the recent breakdown below both of these 60-minute trendlines (white-primary & yellow-alternative TL).
-

- FB daily Aug 15th
-

- FB 60-minute 2 Aug 15th