
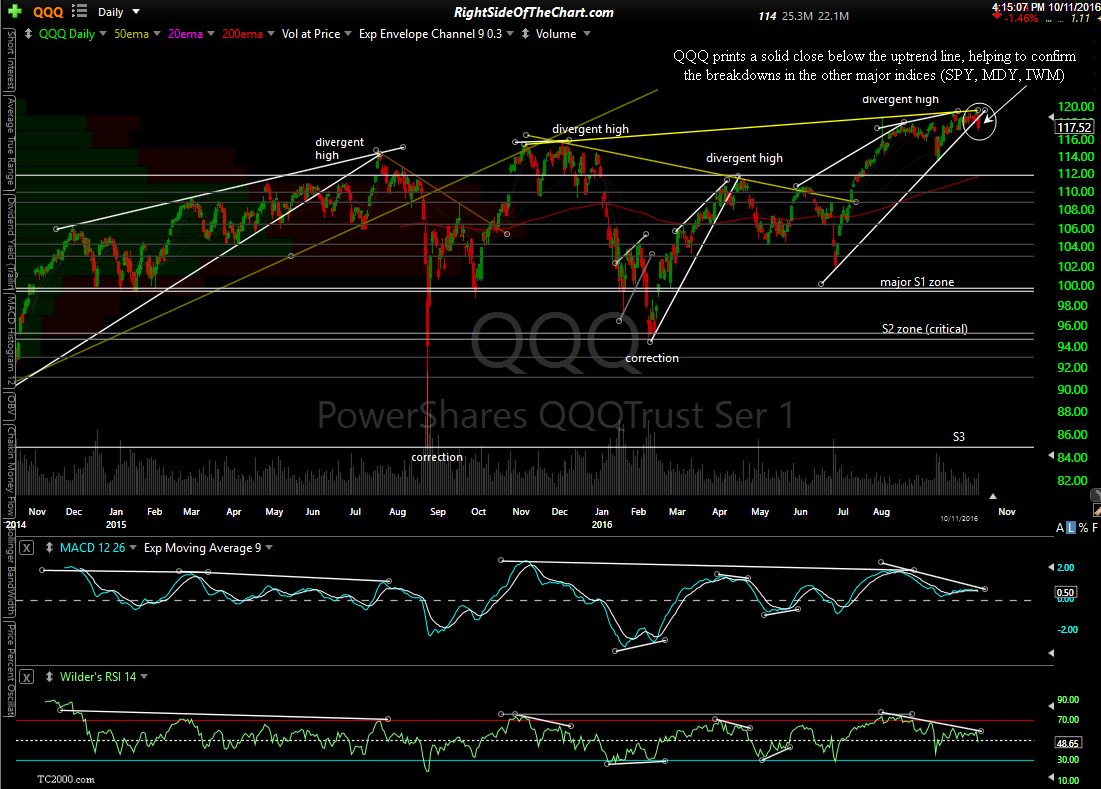
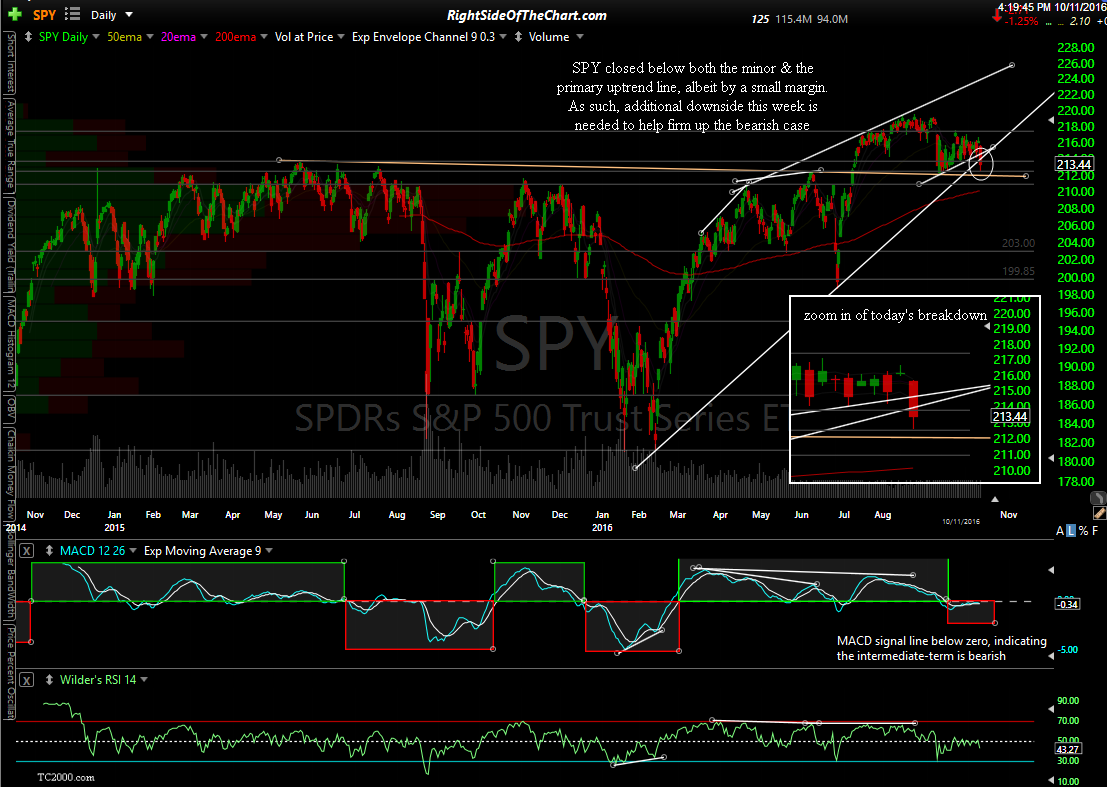
Essentially, as of today, all major US stock indices have broken down & are trading below key uptrend lines, considerably increasing the odds for a correction in the coming weeks to months although there is still some work to be done in order to firm up the near-term bearish case. For starters, the major averages still have a plethora of support below. Add to that the fact that the $SPX & SPY both closed just a hair below their respective uptrend lines & both SPY & QQQ still remain within the recent sideways trading range from the last several months. As such, I would still prefer to see a solid break below QQQ 116.00 & SPY 212.00 as discussed in the video published earlier today in order to state with a high degree of confidence that the next tradable downtrend has likely begun.
-

- QQQ daily 2 Oct 11th
-

- SPY daily 2 Oct 11th
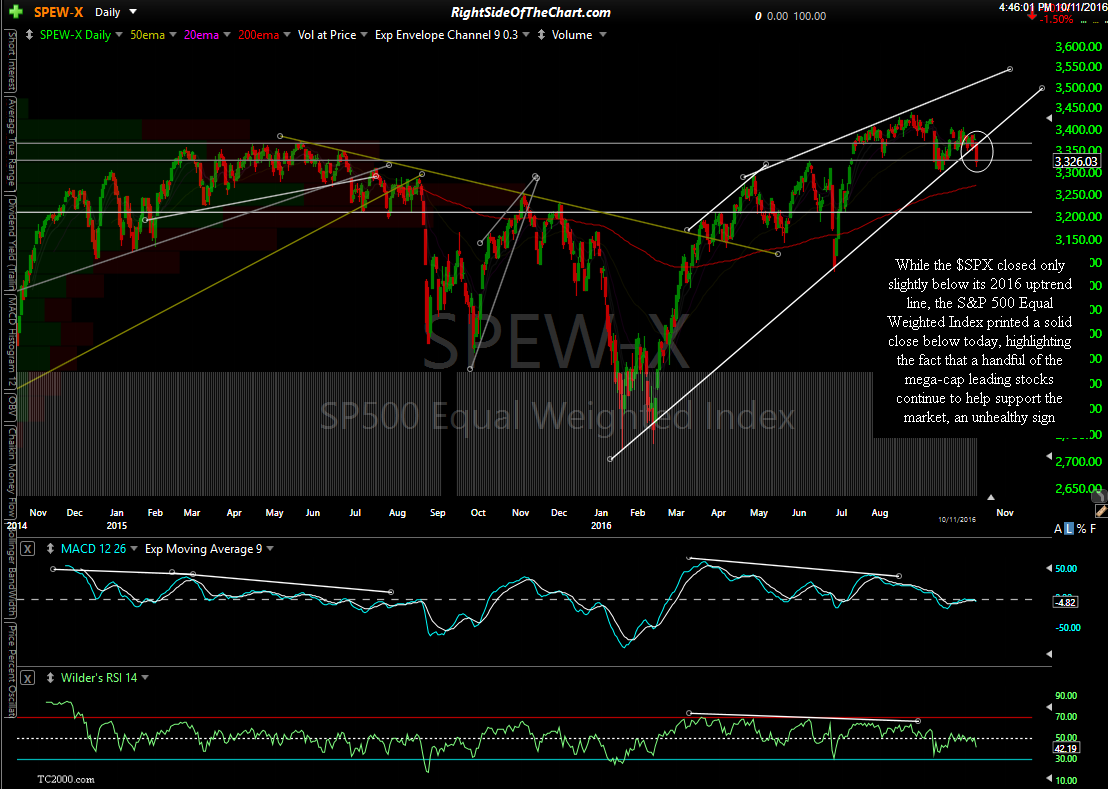
While the $SPX closed only slightly below its 2016 uptrend line, the S&P 500 Equal Weighted Index printed a solid close below today, highlighting the fact that a handful of the mega-cap leading stocks continue to help support the market, an unhealthy sign. Additionally, when you back out the extremely top-heavy weighting of the handful of over-owned, over-loved mega-caps stocks, such as AMZN, that have been doing all of the heavy lifting lately, today’s breakdown as shown here in the Nasdaq 100 Equal Weighted Index is even more impulsive & convincing.
-

- $SPEW daily Oct 11th
-

- $NDX-E daily Oct 11th

Zooming down to the 60-minute charts, we can see that the relatively muted bounce into the close today was a result of the typical reaction off the initial tag of support levels on both the SPY & QQQ, with the SPY reversing smack in the middle of this previously highlighted support zone.
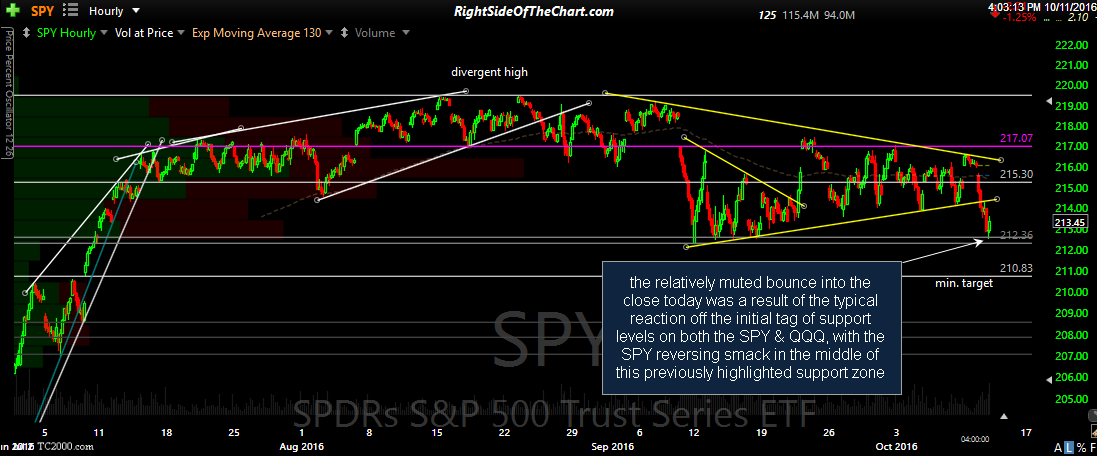
SPY 60-minute 2 Oct 11th
Additional evidence that these technical levels are significant can be viewed by the action off the 117.23 support level today with not one, but the bottom of 3 consecutive candle bodies with a couple of pennies of that level.. a typical reaction but likely a fleeting one with that level likely to be taken out tomorrow.
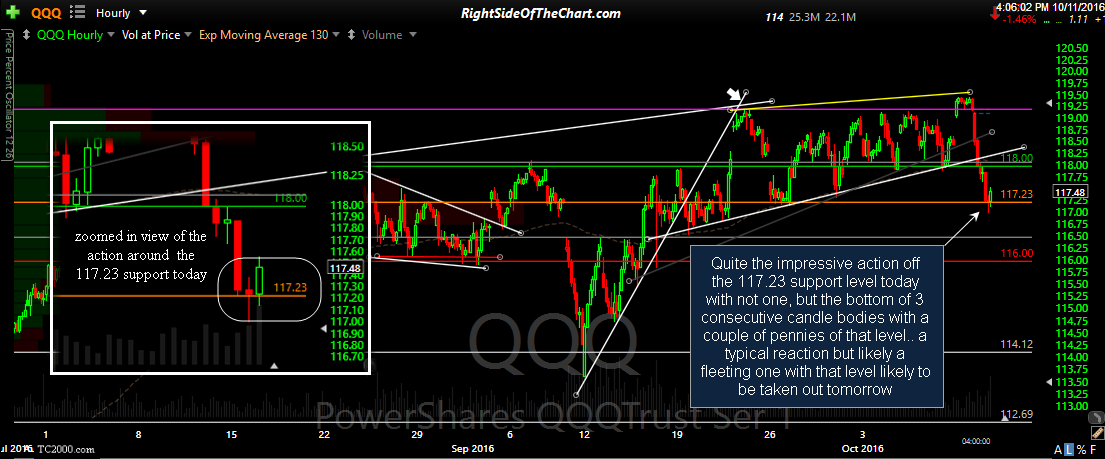
QQQ 60-minute 2 Oct 11th
As I continue to receive quite a few inquires regarding gold, silver & the mining stocks, let me just share my recent comments posted in the trading room earlier today:
My views on GLD & GDX haven’t changed recently. I’ve acknowledged that GLD & the miners were/are at support while oversold, which most certainly could mark the end of the recent correction although I am still very much open to the possibility that both continue to move lower or may even just chop around for a while.
Most importantly, other than oversold & at support, I can’t make a solid case to go long based on my read of the daily & 60-minute charts , which is what I prefer to do when positioning for a trend reversal during a major correction or rally.
The miners can rally 30% from here but they’ll have to do so without me as I just can’t make a strong enough case to be long at this time. As you probably know, even being stuck in a sideways trading range in the miners can be very frustrating & is likely to run one’s stops due to the choppy, intraday & day-to-day big price swings in the miners.I should add that I will post any significant developments that I see in gold, silver & the miners although I have to say that I’m not following them as closely right now. Therefore, (everybody) feel free to drip on me for my thoughts on the metals or miners as the one thing about them is they can move so fast that the charts could start to set up for a swing trade opp in very short order.
If I had to venture a guess, I would say that GDX is most likely about to take one more considerable thrust lower before putting in a swing-tradable bottom. Just my best guess based on my read on the charts but the R/R to shorting the miners here just isn’t very attractive.