
As with the other US stock indexes, QQQ has potential bullish divergences in place which are worth monitoring, should prices move higher into next week. Today the Q’s dipped below the recent trading range but found support at the May 6th reaction lows. (edit: the previous posted 60-minute charts for QQQ & SPY were the same charts posted earlier today. The updated charts, as of today’s close, have been added below)

QQQ 60-minute May 19th
SPY broke below the 204.00 support level today & closed essentially on it. As with QQQ, IWM, etc. the SPY 60 minute trend indicators are bearish but there are potential bullish divergences worth monitoring.
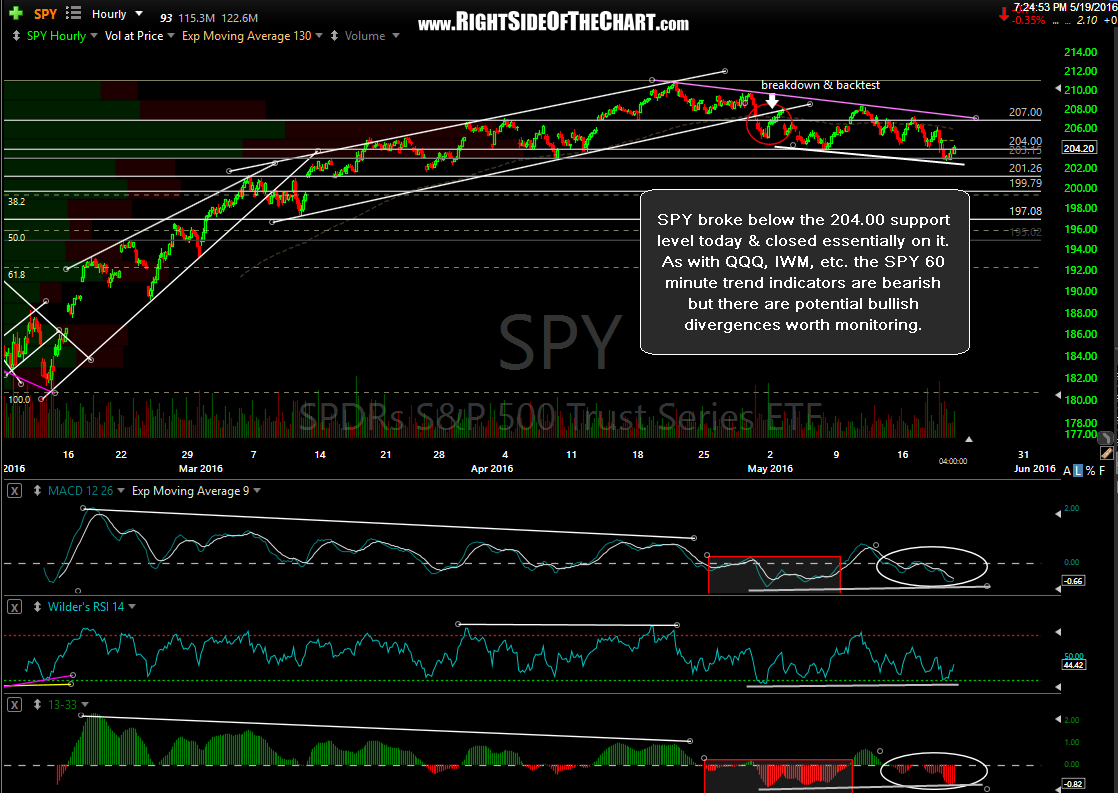
SPY 60-minute May 19th
IWM bounced off the top of my 108ish support zone today while still holding onto the potential bullish divergences that remain on the 60-minute time frame. Barring a possible OpEx rally tomorrow, my expectation remains that the current downtrend in IWM will continue in the coming days/weeks, ultimately burning through these divergences.
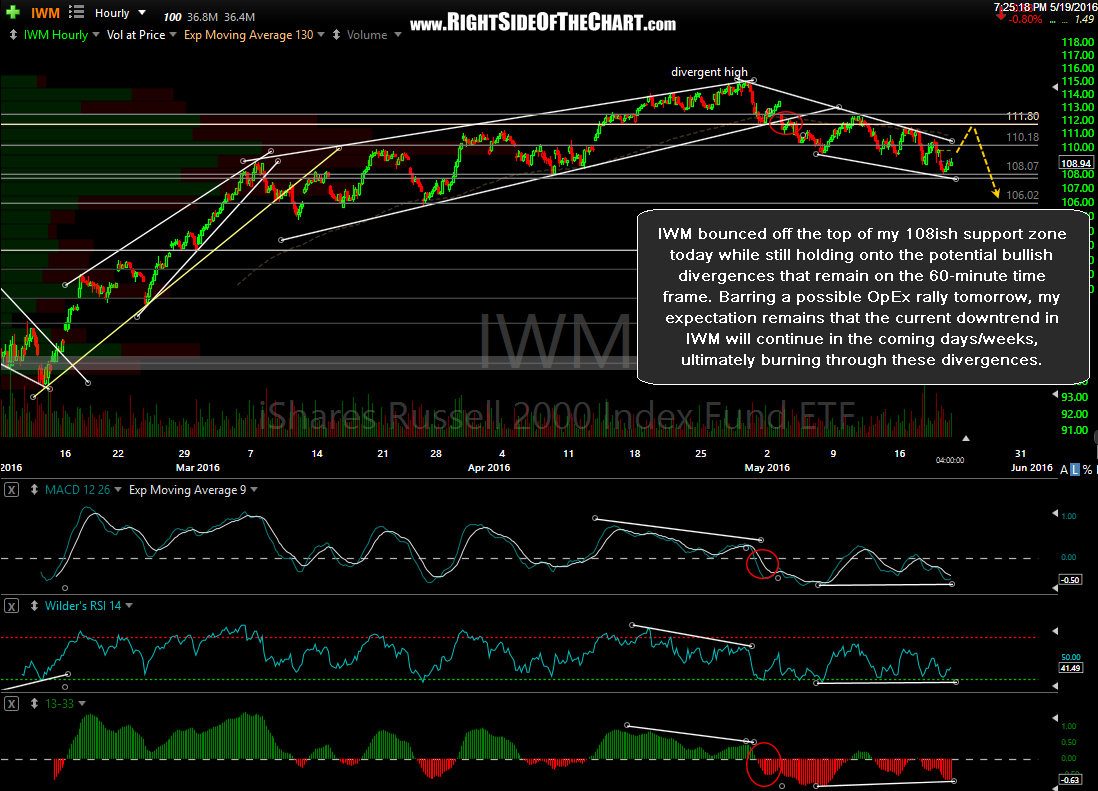
IWM 60-minute May 19th
XLE clearly broke down below the primary uptrend line off the Jan lows & closed on just below it. This helps to reaffirm the near-term bearish case for the energy sector although the real selling might have to wait until next week as they might hold the market up into OpEx at the end of trading on Friday.
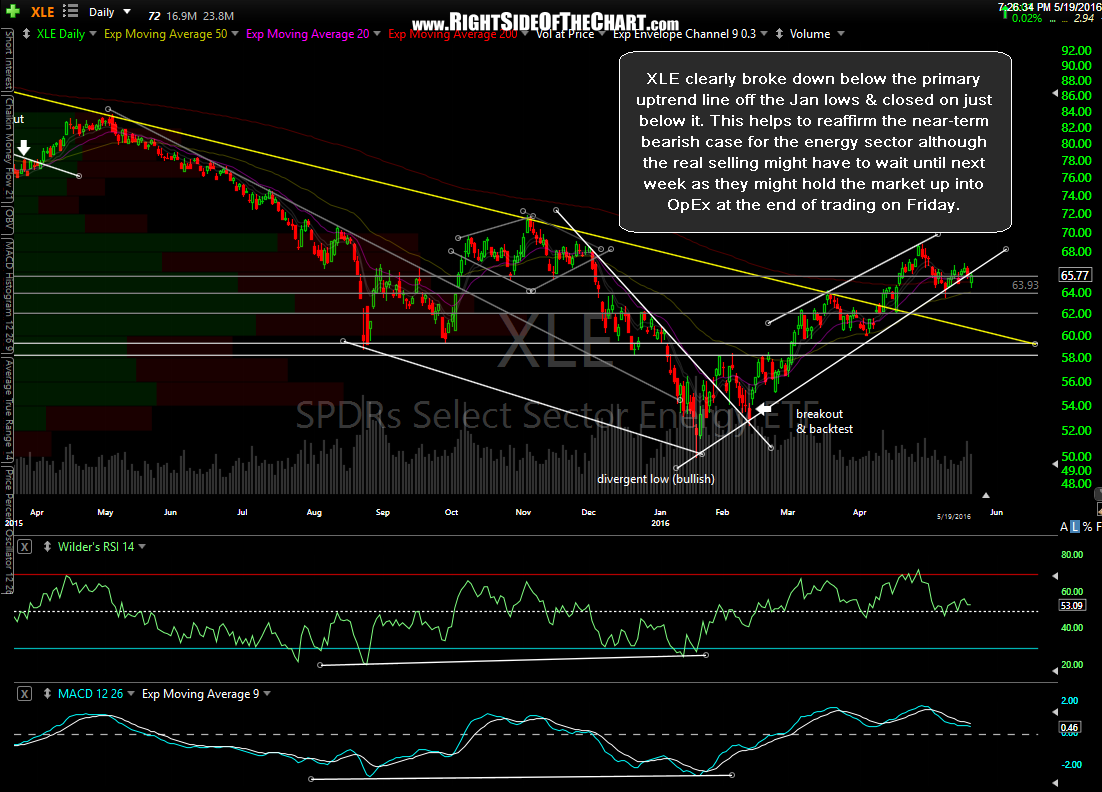
XLE daily May 19th
GLD followed through to yesterday’s impulsive breakdown, confirming the near-term bearish outlook.

GLD daily May 19th
The longer GDX continues to ignore the weakness in GLD, the more violent the mean reversion will be. Despite a green close today, this chart still looks clearly bearish.
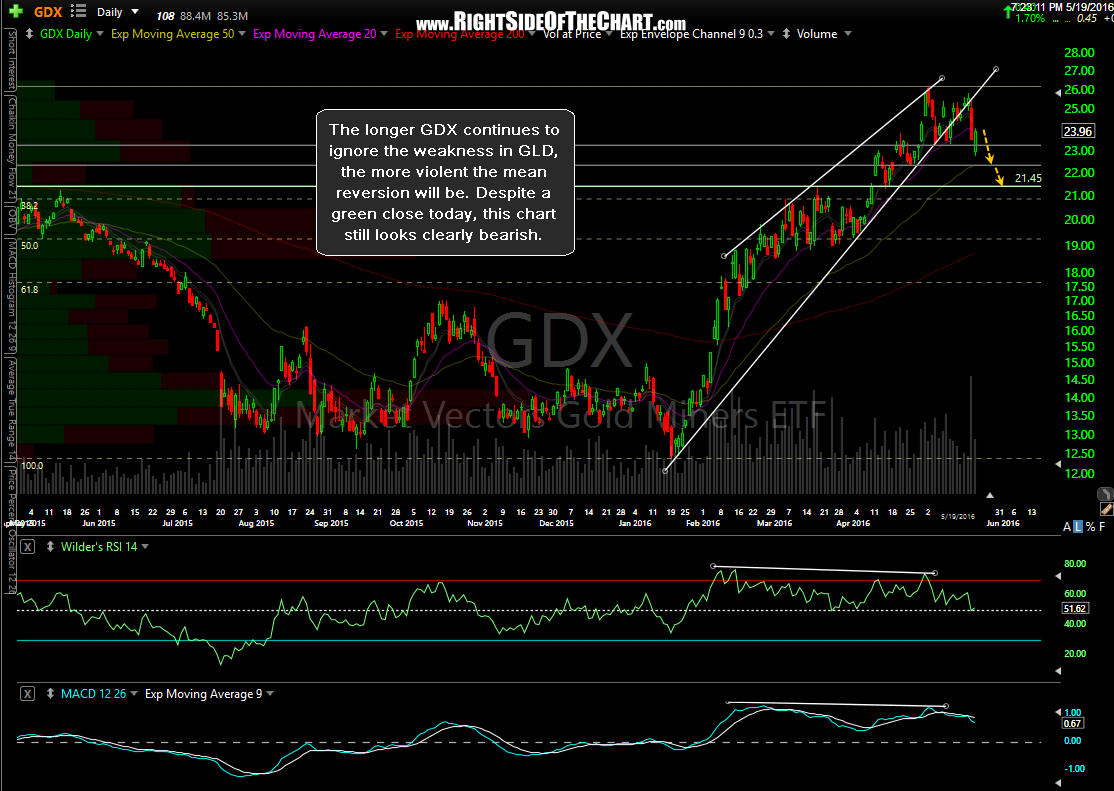
GDX daily May 19th