
The vertical lines on this 2-year chart of the SPY (S&P 500 tracking ETF) show all instances in recent years where volumes have plunged, as measured by the SPY’s volume 10-day EMA , to the red ‘correction’ line. Corrections followed either a touch of that line or the cross back above it following any extended dip below such as these two areas shaded in gray. I’ve pointed out similar reading several times in recent years to help identify corrections, such as in this post back on April 27, 2015 which came just 3 weeks & rougly 0.65% before the market peaked on May 21st, plunging over 15% over the next 8 months (by far, the largest correction in years). note: since then, the correction line was slightly lowered to more accurately refine the sell signal due to slightly lower extreme readings since then.
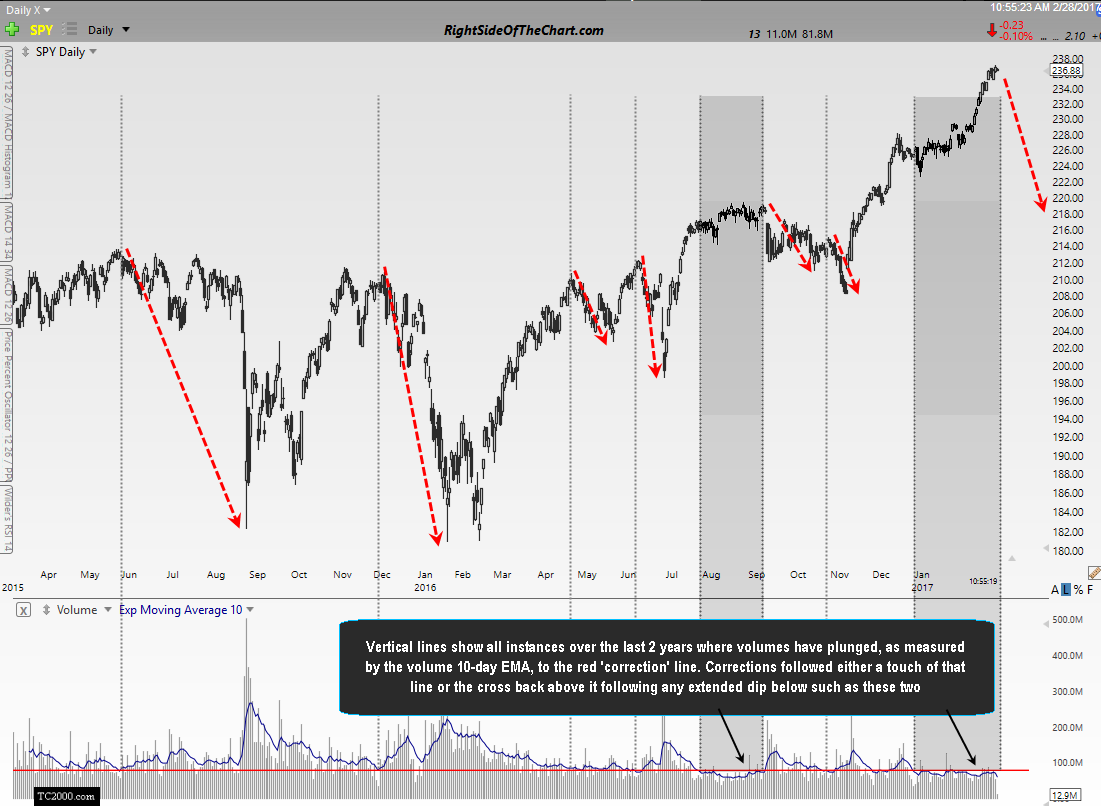
SPY low volume sell signals Feb 28th
The current low volume extreme is the most extended period that both the SPY & QQQ have experienced their respective volume 10-day EMAs trading below their correction lines that I can recall in years. While some tags of those “correction lines” result in a near immediate correction, there are periods of extended extreme low-volume readings, such as this one, which make this indicator more of a warning sign of an impending correction than an actually sell signal or exact timing indicator. That’s were trendline & support level breaks, bearish candlestick reversal patterns, trend indicators such as moving average crossovers, etc.. help to hone in on the timing of a short entry or reducing long exposure. With that being said, additional confirmation that a correction may have likely begun would be a cross of the volume 10-ema back above the red “correction line”. For those that would like to replicate this chart, that line is currently set at 80,905,000 on the chart above.
The fact that the stock market continues to advance on such low volume coupled with divergences & extreme overbought readings on numerous time frames, deterioration in market internals, extreme valuation levels, extreme lows in short interest, recent extreme bullish sentiment readings in recent months, etc, etc, etc…. give me the highest degree of confidence that not only is the current rally most likely in its final stages but that the ensuing correction is quite likely to be unusually swift & severe.
As such, I will continue to trade the best looking setups both long & short with a bias towards short setups, particularly on the official trade ideas for the foreseeable future. Plenty of long trade ideas, in fact more longs than shorts have been posted in trading room in recent months & I will continue to post the best looking setups, both long & short, regardless of the outlook for the broad market.